Market News
Trade setup for 5 July: NIFTY50 sparks profit booking at all-time high, weekly close to guide next moves
.png)
4 min read | Updated on July 05, 2024, 07:47 IST
SUMMARY
The weekly charts of both the NIFTY and BANK NIFTY are in the process of forming a bullish structure. The NIFTY50 is trading above the previous week's high, while the BANK NIFTY is facing resistance in this area. Traders can keep an eye on the weekly close for both indices, as a close above the previous week's high will indicate strength.

On the daily chart, the BANK NIFTY index has formed a negative candlestick pattern.
Asian markets update
The GIFT NIFTY is trading lower, indicating a flat to negative start for Indian equities today. Meanwhile, other Asian markets are also trading in positive territory. Japan's Nikkei is trading flat, up 0.1%, while Hong Kong's Hang Seng Index rose 0.2%.
U.S. market update
The U.S. indices were closed on Thursday in observance of Independence day. On Friday, the markets will react to the jobs report for June. The forecast is for an increase of 1,90,000 in payrolls, which is lower than the 2,72,000 increase in June.
NIFTY50
July Futures: 24,359 (▲0.1%) Open Interest: 5,81,701 (▲0.4%)
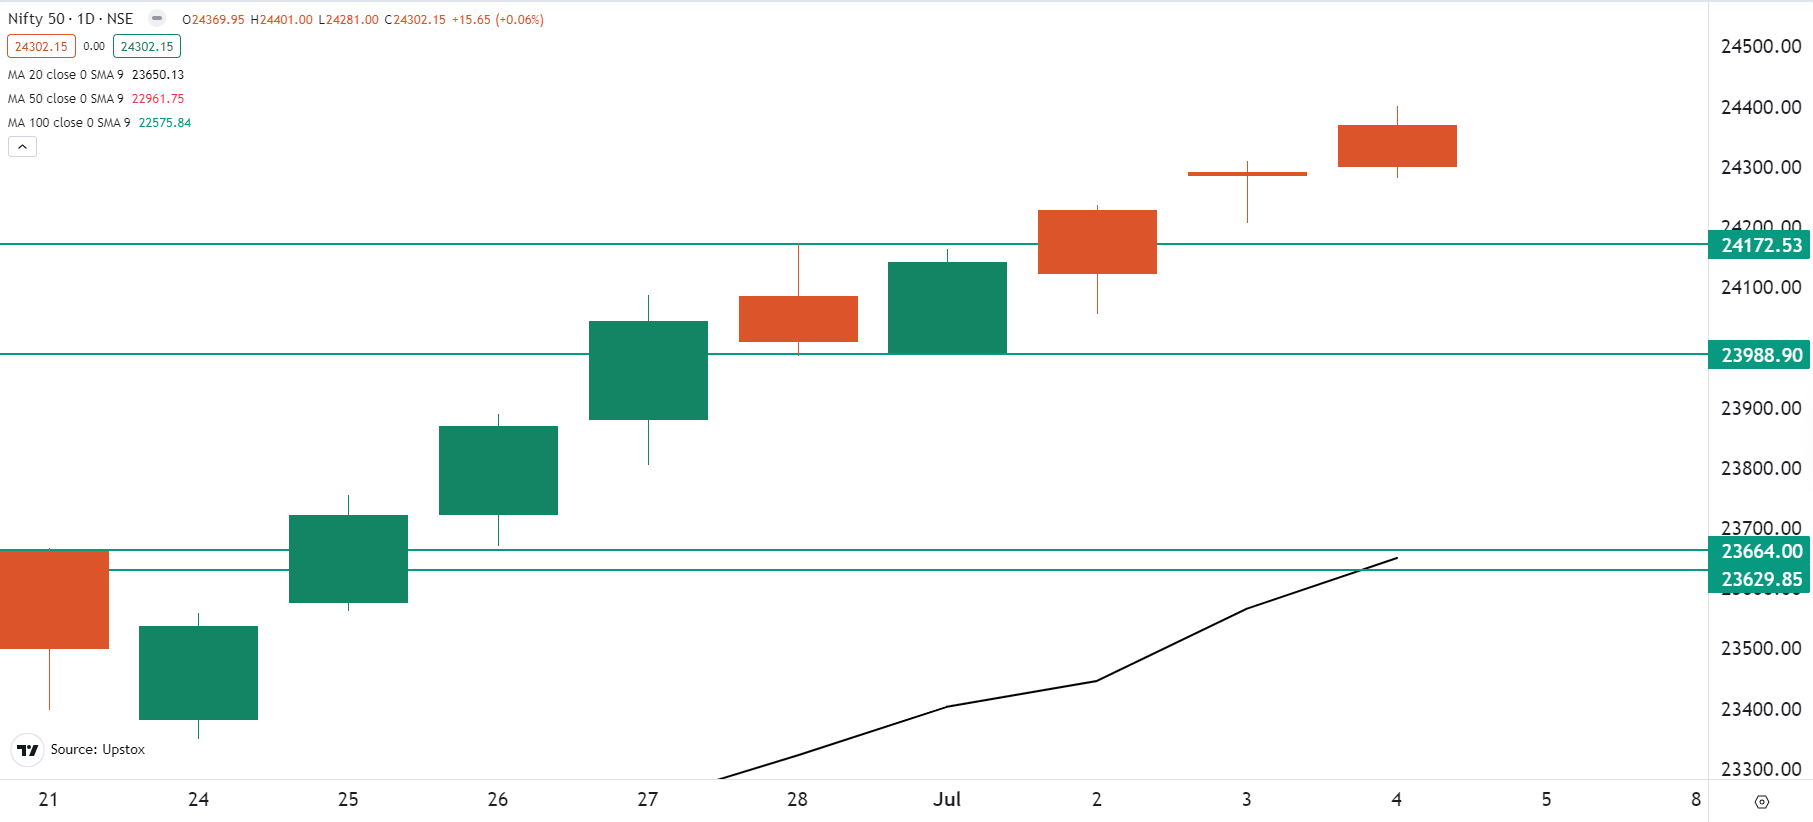
Following positive global cues, the NIFTY50 index opened Thursday's session with a gap-up of over 80 points and hit a fresh all-time high. However, profit-taking at higher levels prevented a follow-through.
According to yesterday's analysis, the NIFTY50 index protected the 24,200 level on the expirY day and closed above it. However, on the daily chart it formed a doji-shaped candlestick pattern at the all-time high. The doji is a neutral pattern that indicates indecision among investors.
Traders should keep an eye on the previous week's high of 24,172 for the next few sessions. A close above this level will indicate bullishness, while a close below it will indicate consolidation at higher levels. Positionally, weakness on the index will only be seen if it closes below the 23,700 zone.

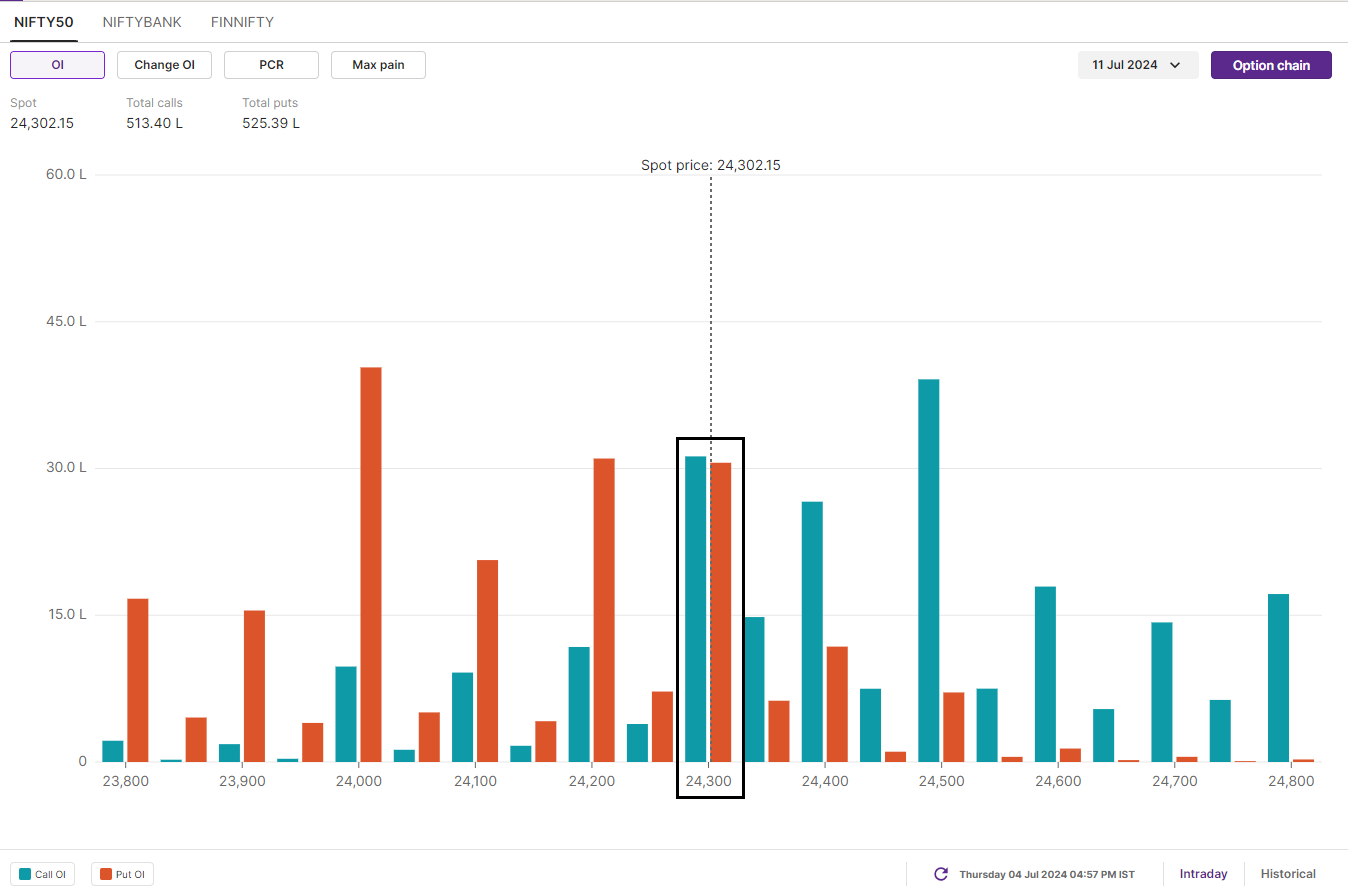
The initial build-up of open interest for the 11 July expiry suggests range-bound activity. The 23,300 strike saw a significant increase in call and put open interest. Meanwhile, the highest open interest was also seen at the 24,500 call and 24,000 put strikes.

BANK NIFTY
July Futures: 53,166 (▲0.1%) Open Interest: 1,86,189 (▲0.3%)
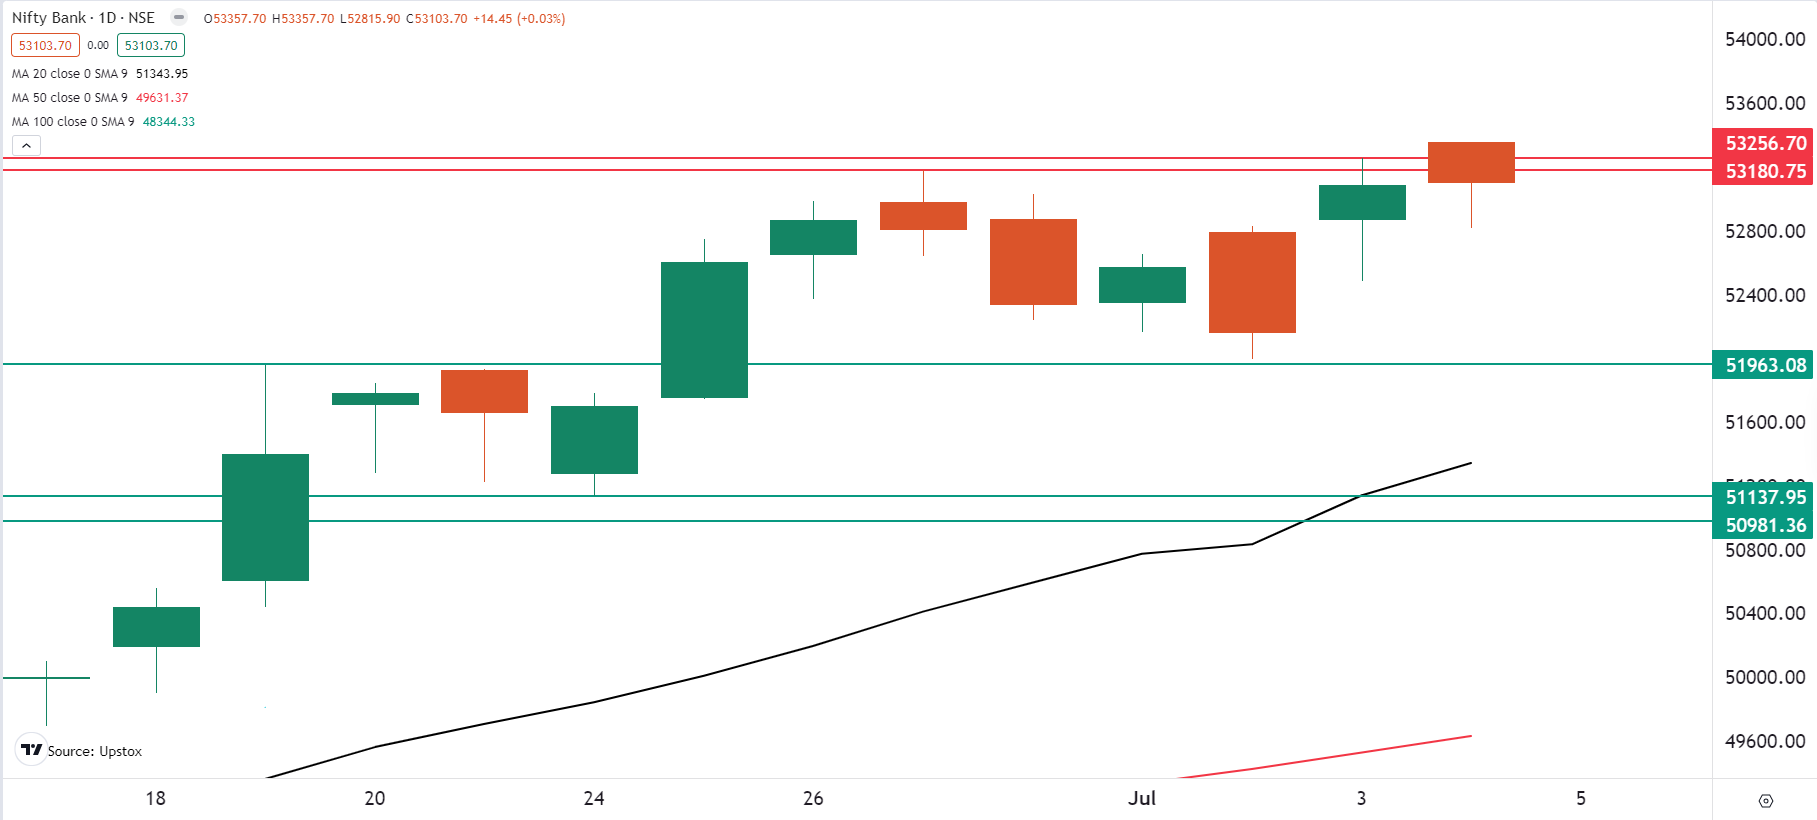
The BANK NIFTY also started the day on a positive note but faced stiff resistance around its recent all-time high (53,180). The weakness in the index was led by HDFC Bank which witnessed profit booking after the recent rally.
On the daily chart, the BANK NIFTY index has formed a negative candlestick pattern, indicating a pause. Currently, the index is consolidating between the recent all-time high (53,180) and the 52,000 level, which is the immediate key support for the index. A break of this zone on a closing basis will provide traders with further directional clues.

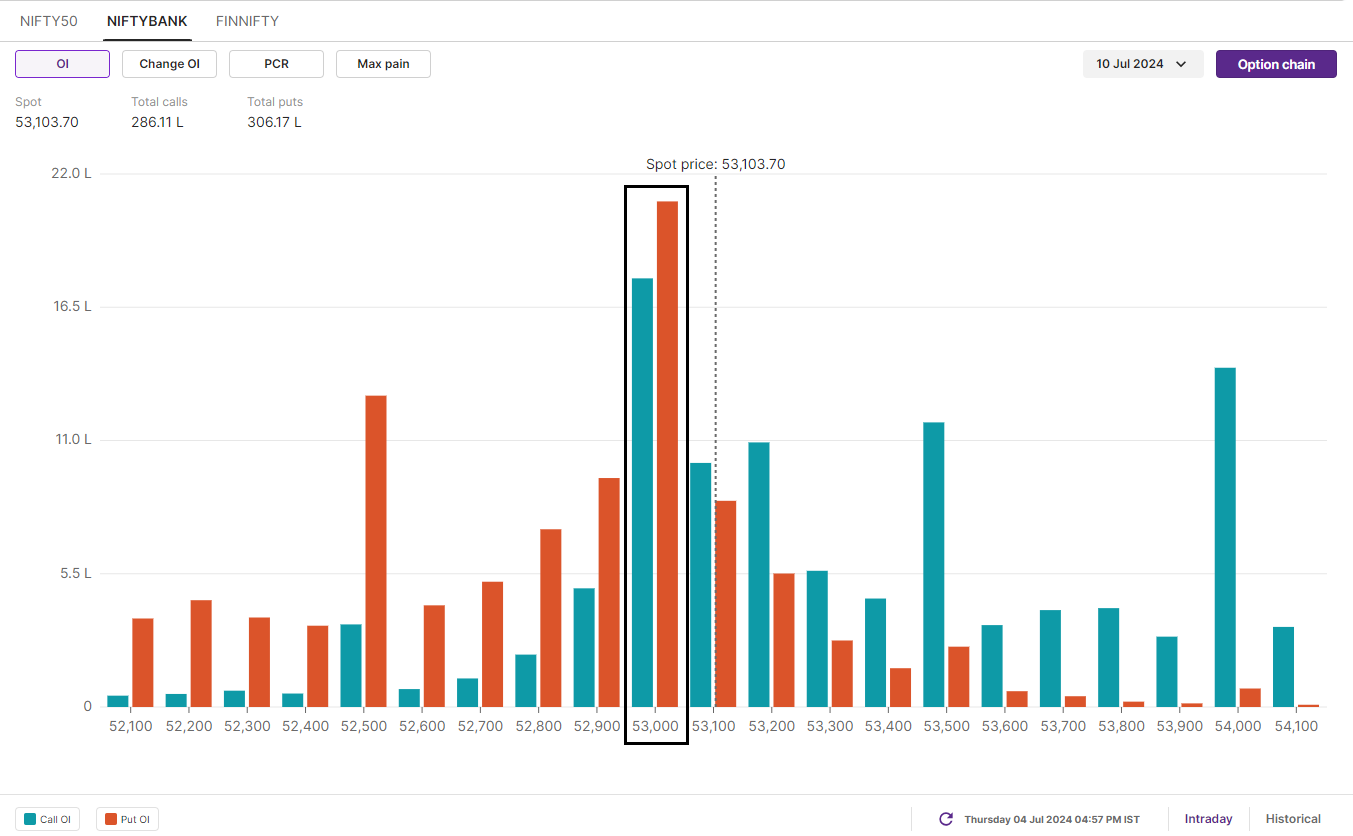
The open interest build-up for the 10 July expiry saw significant call and put OI at the 53,000 strike. This options data, together with the charts, also signals range-bound activity.

FII-DII activity
Stock scanner
Long build-up: Lupin, Zydus Lifesciences, Dr. Lal Pathlabs, Granules India and Metropolis
Short build-up: Ramco Cements, Bajaj Finance, Bandhan Bank and Gujarat Gas
Under F&O Ban: Aditya Birla Fashion and Retail, Bandhan Bank, Hindustan Copper, India Cements and Piramal Enterprises
In Futures and Options or F&O, long build-up means an increase in Open Interest (OI) along with an increase in price, and short build-up means an increase in Open Interest(OI) along with a decrease in price.
Source: Upstox and NSE.
Disclaimer: Derivatives trading must be done only by traders who fully understand the risks associated with them and strictly apply risk mechanisms like stop-losses. The information is only for consumption by the client and such material should not be redistributed. We do not recommend any particular stock, securities and strategies for trading. The securities quoted are exemplary and are not recommendatory. The stock names mentioned in this article are purely for showing how to do analysis. Take your own decision before investing.
About The Author
Next Story

