Market News
Trade Setup for Oct 3: BANK NIFTY stumbles for third day, eyes critical 20-DMA
.png)
5 min read | Updated on October 03, 2024, 08:15 IST


SUMMARY
The Bank Nifty index has formed a pause candle with a large upper shadow, signalling selling pressure at higher levels. Immediate support lies at the 20-day moving average (DMA) and the 51,750 area. A close below the 20 DMA could trigger further bearish movement.

NIFTY50 and SENSEX face resistance at higher levels as per latest option chain
Asian markets update
The GIFT NIFTY is down over 1%, indicating a gap down and a negative start for the NIFTY50 today. Meanwhile, other Asian indices are trading mixed. Japan's Nikkei 225 is up 2%, while Hong Kong's Hang Seng slipped over 2%.
U.S. market update
Dow Jones: 42,196 (▲0.0%)
S&P 500: 5,709 (▲0.0%)
Nasdaq Composite: 17,925 (▲0.0%)
U.S. indices ended Wednesday's session just above the flat line as rising tensions between Israel and Iran weighed on investor sentiment.Against this backdrop, the price of Brent Crude and West Texas Intermediate rose over 4% in the last two days to $74 and $71 respectively.
NIFTY50
October Futures: 25,969 (▼0.0%) Open Interest: 5,80,155 (▼2.6%)
The NIFTY50 index remained under pressure for the second consecutive day and ended Tuesday’s session flat. The index formed a doji candlestick pattern on the daily chart, indicating indecision or pause at current levels.
A doji is a neutral candlestick pattern which indicates that the traders remained indecisive, resulting in the closing near the opening price. However, it is important to note that the index failed to show any meaningful recovery during intraday and ended the day around previous session’s low.
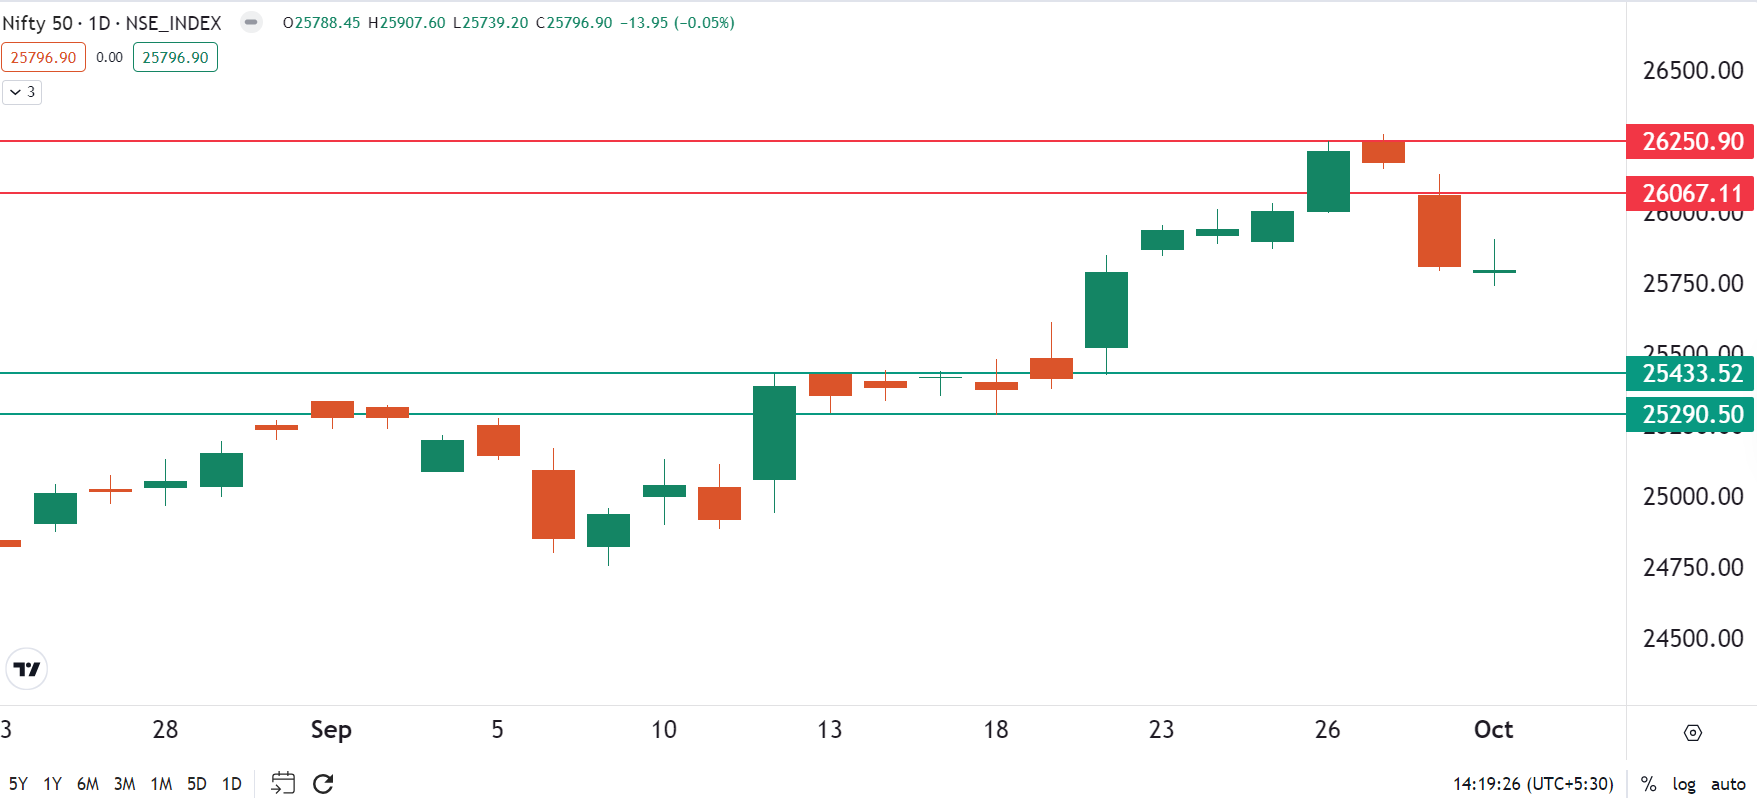
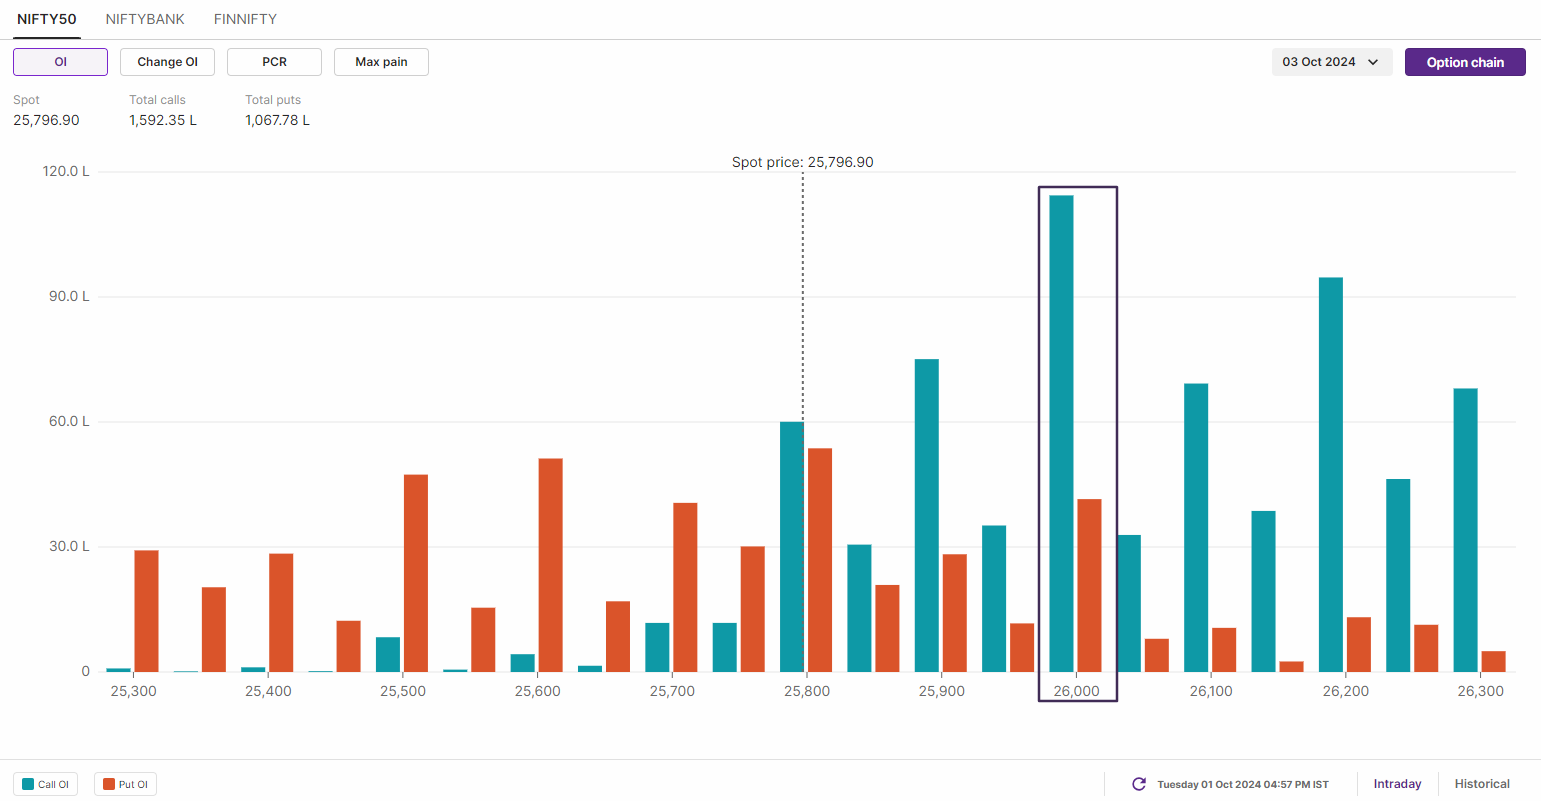
The open interest data for today’s expiry has strong call base at 26,000 and 26,200 strikes, suggesting that index may face resistance around these strikes. On the flip side, there was no strong base visible on the put side except for 25,000 strike, indicating that the next crucial support for the index is around 25,000 zone.
BANK NIFTY
October Futures: 53,381 (▼0.0%) Open Interest: 1,30,312 (▲9.3%)
The BANK NIFTY index extended its losses for the third day in a row, ending Tuesday's session below the previous day's low, indicating weakness. The index traded in a narrow range during the expiry of its options contracts and witnessed significant volatility.
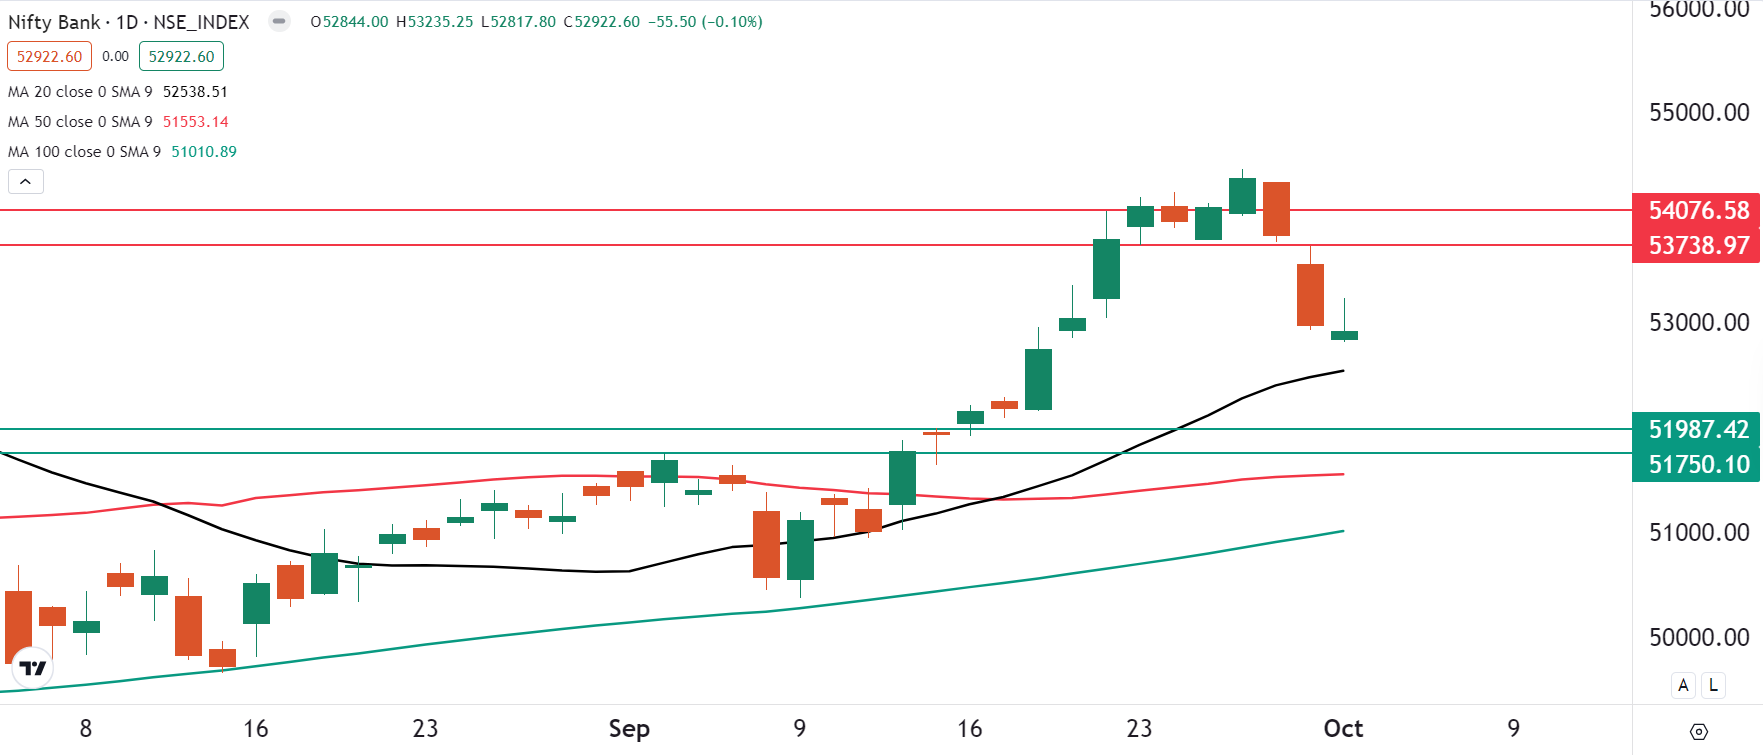
On the weekly chart, the index is beginning to show signs of confirming a shooting star candlestick pattern, which is a bearish reversal pattern. If the index maintains the bearish momentum and price structure and closes below the low of the reversal pattern, we may see further weakness.
FII-DII activity
Stock scanner
Long build-up: National Aluminium, Crompton Greaves, Granules India, Chambal Fertilisers and Tata Chemicals
Short build-up: Punjab National Bank, Jubilant FoodWorks, Muthoot Finance and Manappuram Finance
Under F&O ban: Bandhan Bank, Birlasoft, Hindustan Copper and RBL Bank
Out of F&O ban: Balrampur Chini Mills
Added under F&O ban: Birlasoft
In Futures and Options or F&O, long build-up means an increase in Open Interest (OI) along with an increase in price, and short build-up means an increase in Open Interest(OI) along with a decrease in price.
Source: Upstox and NSE.
Disclaimer: Derivatives trading must be done only by traders who fully understand the risks associated with them and strictly apply risk mechanisms like stop-losses. The information is only for consumption by the client and such material should not be redistributed. We do not recommend any particular stock, securities and strategies for trading. The securities quoted are exemplary and are not recommendatory. The stock names mentioned in this article are purely for showing how to do analysis. Take your own decision before investing.
About The Author
Next Story