Market News
Trade setup for 2 July: NIFTY50’s bullish engulfing pattern strengthens 24,000 support zone
.png)
4 min read | Updated on July 02, 2024, 08:56 IST
SUMMARY
The NIFTY50 index nullified the shooting star pattern on the daily chart, forming a bullish engulfing pattern instead. However, traders are advised to wait for the close of the next candle to confirm the validity of this bullish signal.

After a flat start, the NIFTY50 gradually moved higher following profit taking on the 28th and closed higher on Monday.
Asian markets update
The GIFT NIFTY, currently up by 0.1%, points, indicates a positive opening for Indian equities. In line with Wall Street, Japan’s Nikkei 225 has gained 0.6%, and Hong Kong’s Hang Seng index rose by 0.2%, reflecting a broader uptrend in the Asian markets.
U.S. market update
- Dow Jones: 39,169 (▲0.1%)
- S&P 500: 5,475 (▲0.2%)
- Nasdaq Composite: 17,879 (▲0.%)
U.S. stocks closed higher on Monday, starting the second half of 2024 on a positive note. While the broader market remained under pressure, all members of the magnificent seven were higher. The EV giant Tesla was up more than 6% ahead of its quarterly results due later today. In the truncated week, the focus will be on June jobs report due Friday.
NIFTY50
- July Futures: 24,206 (▲0.3%)
- Open Interest: 5,83,609 (▲3.0%)
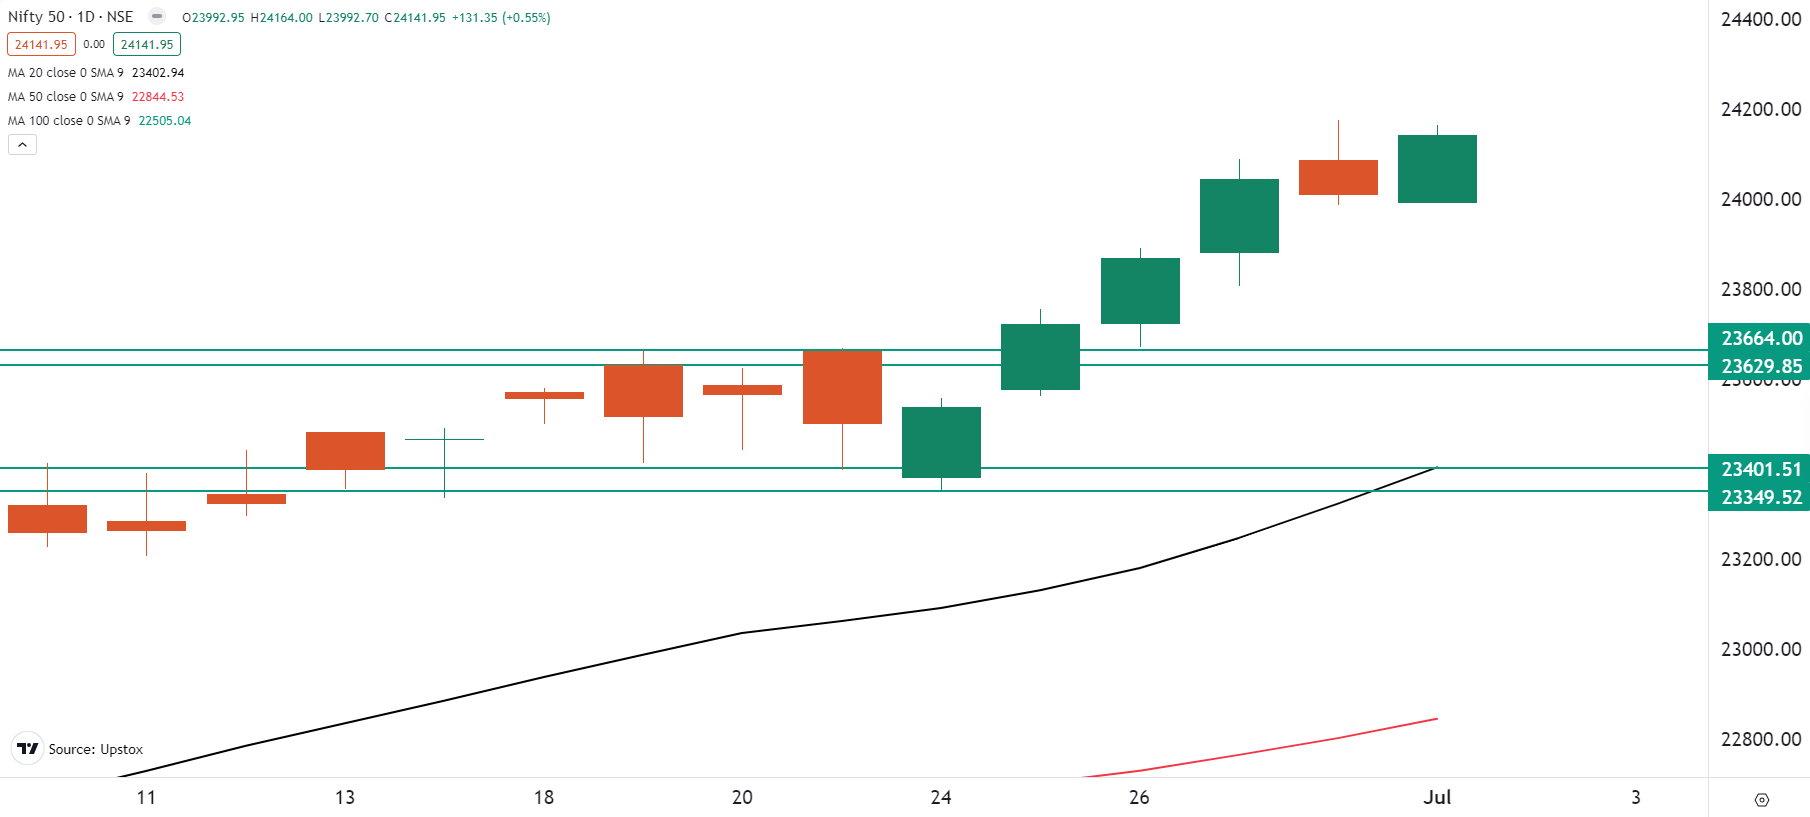
After a flat start, the NIFTY50 gradually moved higher following profit taking on the 28th and closed higher on Monday. The index invalidated the bearish reversal (shooting star) pattern formed on the 28th and instead formed a bullish engulfing pattern.
In the coming sessions, traders should closely monitor the confirmation of the bullish candlestick pattern. If the index closes above the bullish pattern formed on 1 July, it could signal the beginning of a move towards 24,500. Conversely, the key support zone for the index is between 23,800 and 23,700. Additionally, if the index holds 24,150 on an intraday basis, we could see a sharp move higher.

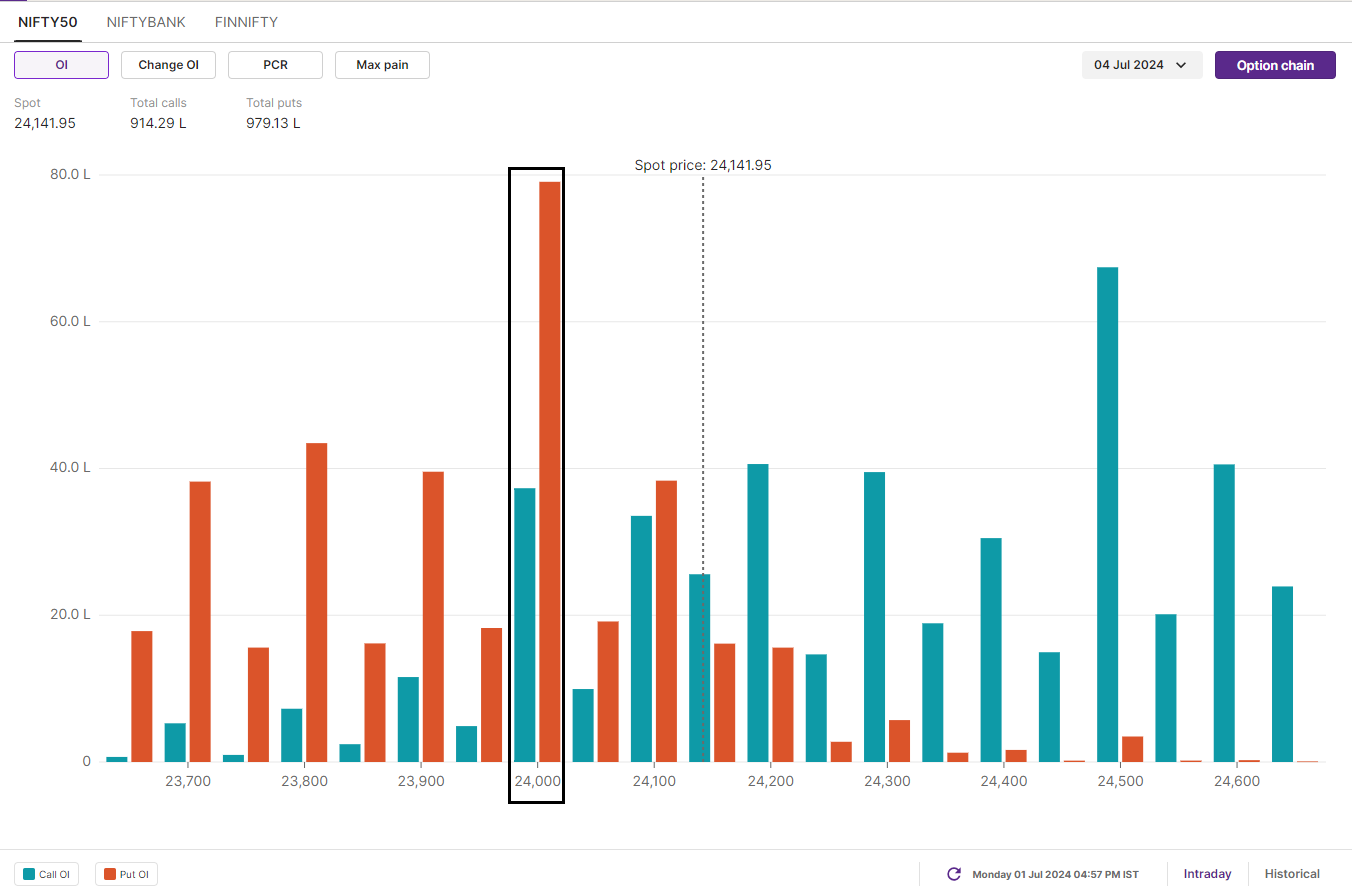
The open interest data for the 4 July expiry saw significant put writing at 24,000 contract along with 23,500. The build-up of put base at these levels indicate crucial support zones for the index. Meanwhile, the significant call open interest is placed at 24,500 strike, which will act as immediate resistance for the index.

BANK NIFTY
July Futures: 52,709 (▲0.3%) Open Interest: 1,67,295 (▲2.3%)
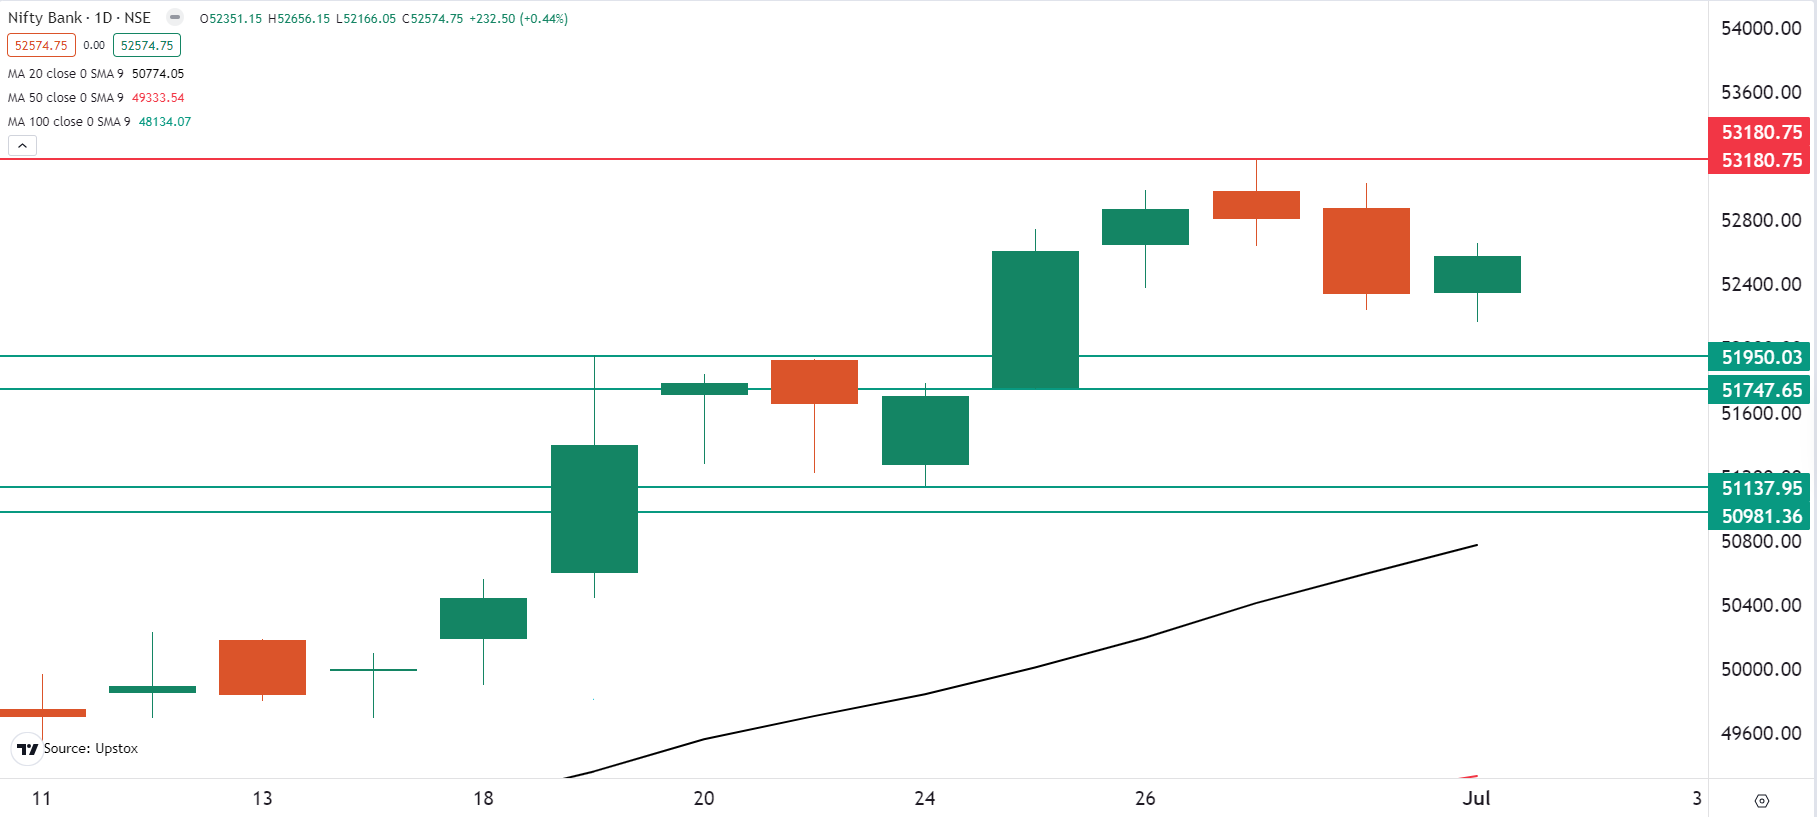
The BANK NIFTY Index rebounded from the day's low and traded in a narrow range throughout the day, protecting the 52,000 level on a closing basis. The index failed to follow through the bearish candle formed on 28 June and staged the first pullback.
However, the chart structure of the BANK NIFTY is at a crucial stage. The index has immediate resistance around the 52,700 area and a break above will lead to a short covering rally to the 53,000—a strike with the highest call open interest. The crucial 53,000 zone will act as resistance for the index. For further directional clues, traders can monitor the price action around these levels and plan their strategies accordingly.

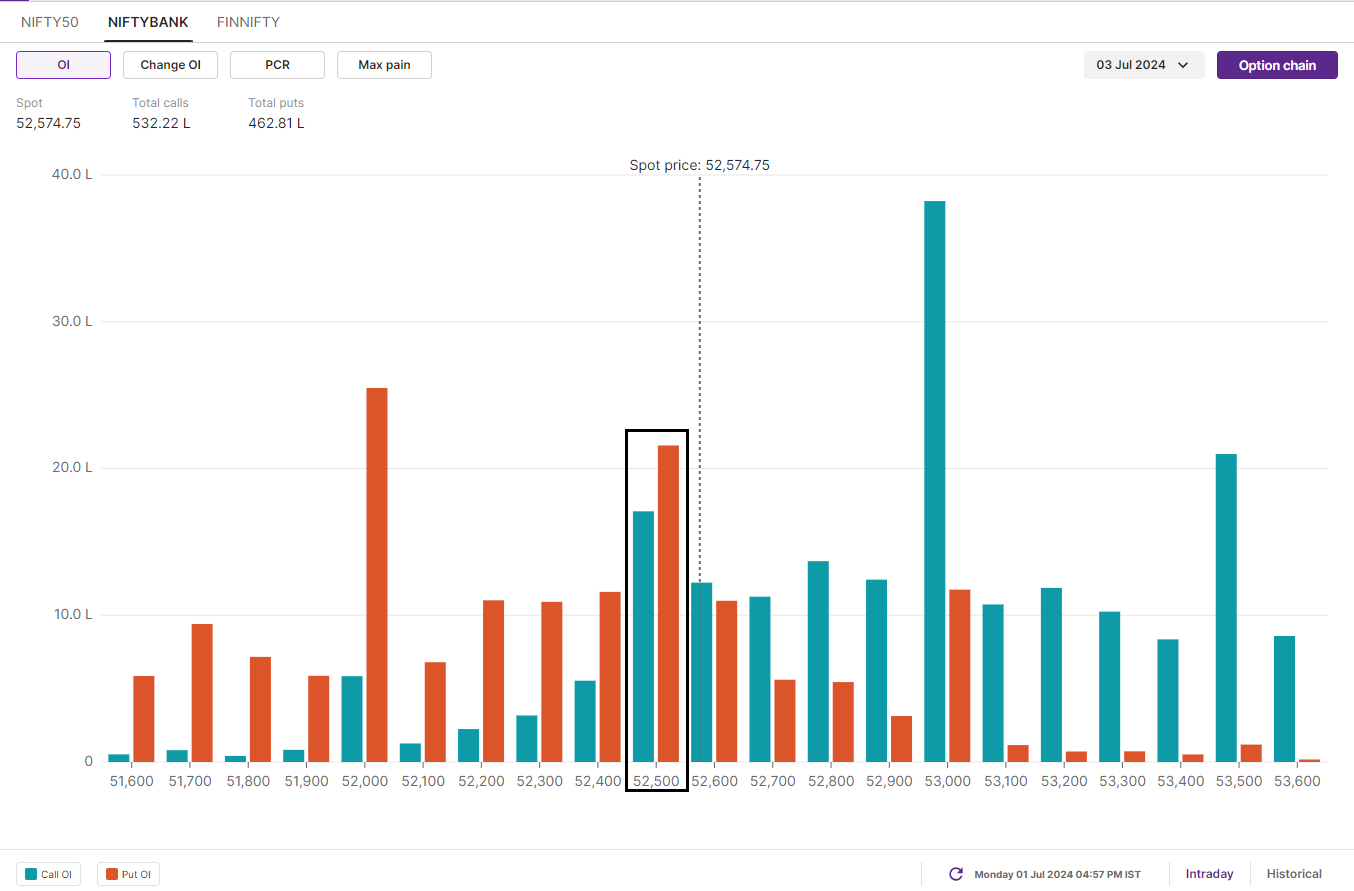
Based on the open interest data, traders have built significant put and call open interest at the 52,500 strike, suggesting range-bound activity in the index. Furthermore, the index has a significant put base at the 52,000 strike. A close below this strike will lead to weakness in the index.

FII-DII activity
Stock scanner
Long build-up: Mahanagar Gas, IEX, Oracle Financial Services Software, Deepak Nitrite, ACC and Aditya Birla Fashion and Retail
Short build-up: NTPC, IDFC and Ashok Leyland
In Futures and Options or F&O, long build-up means an increase in Open Interest (OI) along with an increase in price, and short build-up means an increase in Open Interest(OI) along with a decrease in price.
Source: Upstox and NSE.
Disclaimer: Derivatives trading must be done only by traders who fully understand the risks associated with them and strictly apply risk mechanisms like stop-losses. The information is only for consumption by the client and such material should not be redistributed. We do not recommend any particular stock, securities and strategies for trading. The securities quoted are exemplary and are not recommendatory. The stock names mentioned in this article are purely for showing how to do analysis. Take your own decision before investing.
About The Author
Next Story

