Market News
Trade setup for 19 July: IT stocks spark NIFTY50 rally, bulls engulf previous dojis
.png)
4 min read | Updated on July 19, 2024, 08:01 IST


SUMMARY
The NIFTY50 has formed a bullish engulfing candle on the daily chart ahead of the crucial Q1 results from Reliance Industries and HDFC Bank. In addition, the index is showing early signs of forming another bullish candle on the weekly chart. If the index closes above 24,600, the trend is likely to remain positive.
Stock list
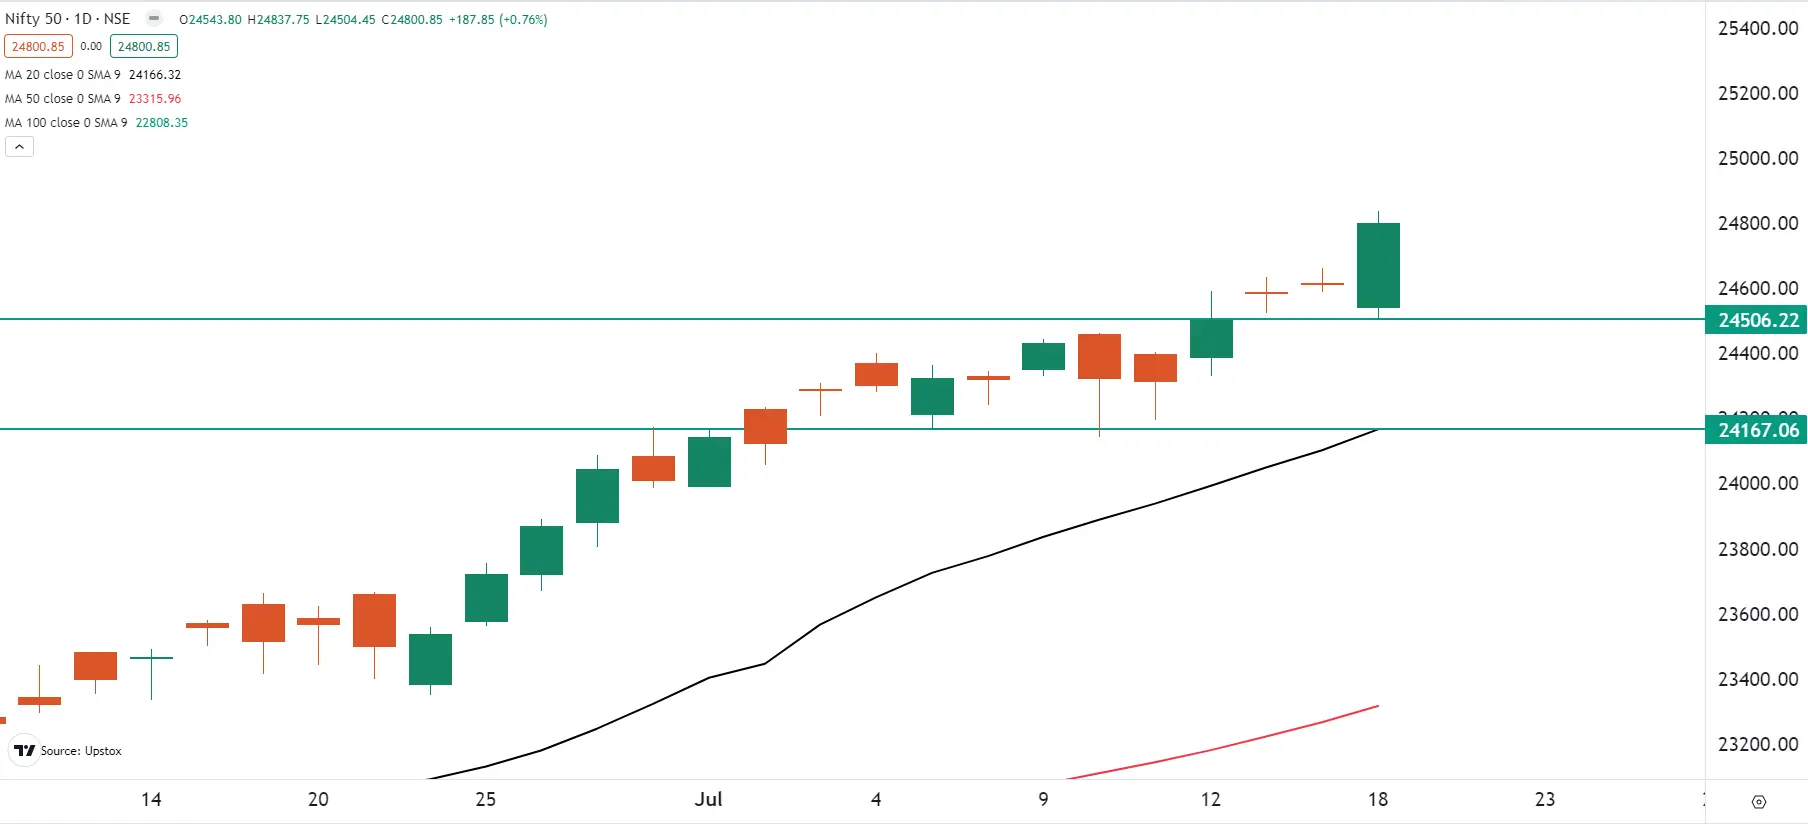
On the daily chart, NIFTY50 has formed a bullish engulfing pattern, negating the two doji candlestick patterns from the previous two sessions.
Asian markets update at 7 am
The GIFT NIFTY is trading flat, indicating a subdued-to-positive start for the Indian equities today. Meanwhile, other Asian markets are trading in the red, with Japan’s Nikkei 225 down 0.1% and Hong Kong’s Hang Seng index slipping nearly 2%.
U.S. market update
- Dow Jones: 40,665 (▼1.2%)
- S&P 500: 5,544 (▼0.7%)
- Nasdaq Composite: 17,871 (▼0.7%)
U.S. indices ended the session lower as the sell-off in large-cap technology stocks continued for the second day in a row. Amid the growing likelihood of a rate cut in September, investors continued to shift towards rate-sensitive sectors.
NIFTY50
- July Futures: 24,809 (▲0.6%)
- Open Interest: 6,02,151 (▲4.9%)
The NIFTY50 started the day on a negative note, slipping below the previous two days' lows in the first half of the session. However, after the initial volatility, the index staged a strong recovery of over 300 points from the day's low to close at a fresh record high. The sharp rally was led by buying in IT and FMCG stocks.
On the daily chart, the index has formed a bullish engulfing pattern, negating the two doji candlestick patterns from the previous two sessions. With the index breaking out and continuing its uptrend, experts believe it may extend its gains towards the psychologically crucial 25,000 mark. In the upcoming sessions, the index has immediate support of around 24,500. As long as the index remains above this level, the trend is likely to remain positive.
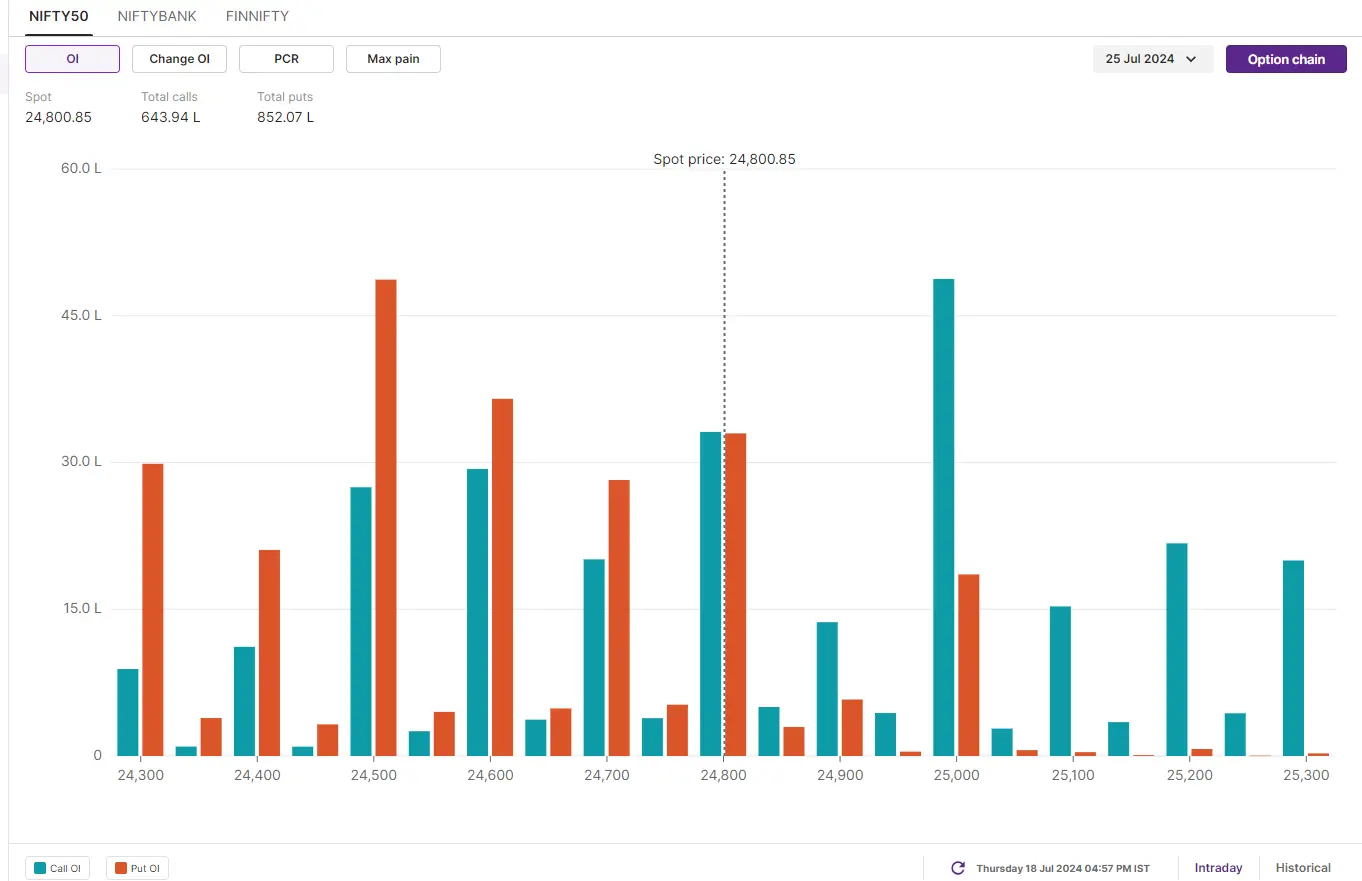
The Open Interest (OI) structure for the monthly expiry shows a significant call OI at the 25,500 strike, indicating resistance around this level. The put base is at the 24,000 strike, which is a key support. However, traders should closely monitor the index's weekly close along with the change in OI for better indications.
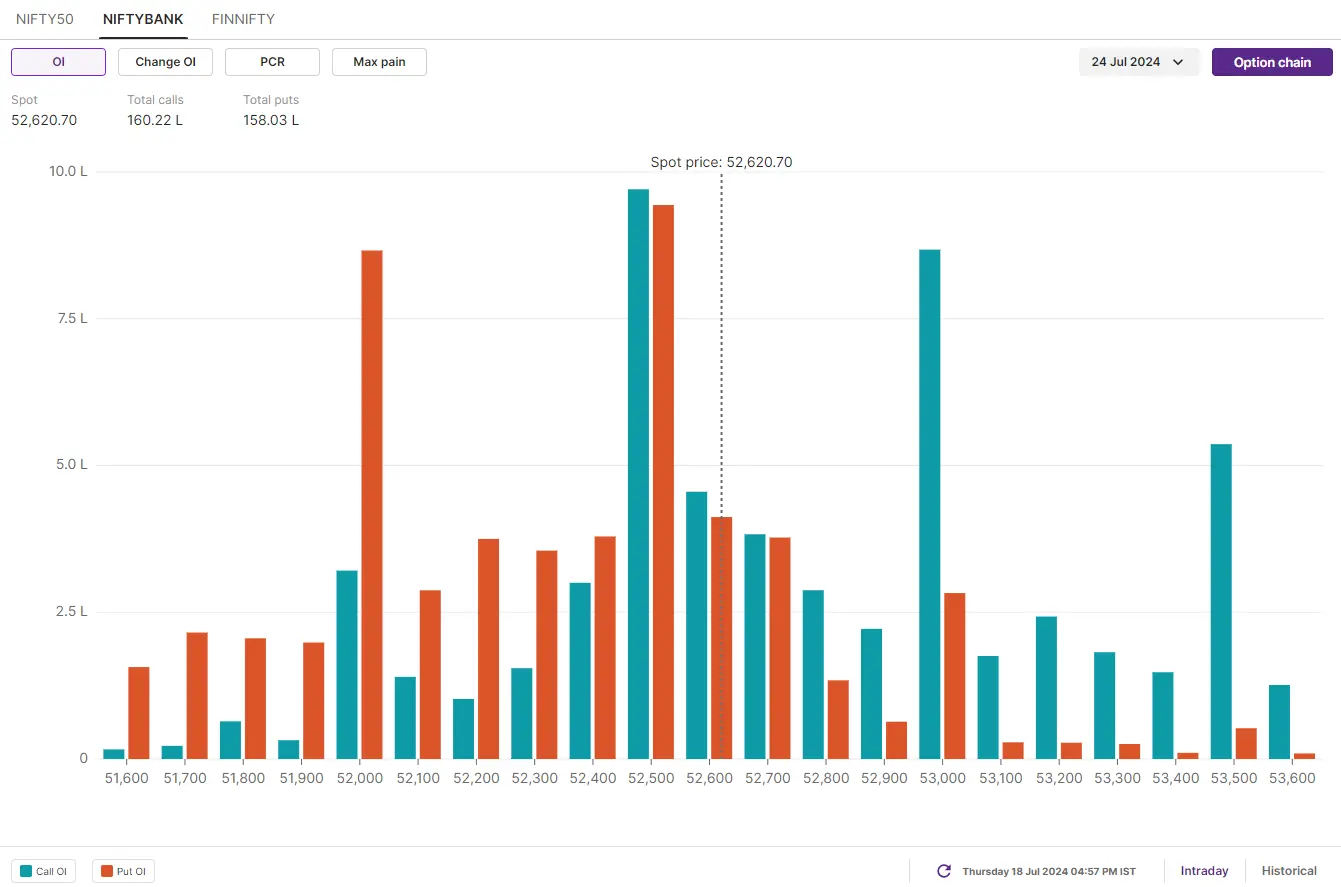
BANK NIFTY
- July Futures: 52,670 (▲0.2%)
- Open Interest: 1,38,027 (▼0.6%)
The BANK NIFTY extended its consolidation for the ninth consecutive day, oscillating between 52,800 and 52,000. The index protected its 20-day moving average (DMA) for the fifth day and formed a bullish engulfing candle on the daily chart.
The formation of a bullish engulfing candle around the key support of the 20 DMA is crucial. However, the pattern will be confirmed if the close of the following candle is higher than the bullish pattern. Immediate support for the index is at 52,000 and resistance remains at 52,800. Until the index breaks out of this range, the trend may remain sideways.
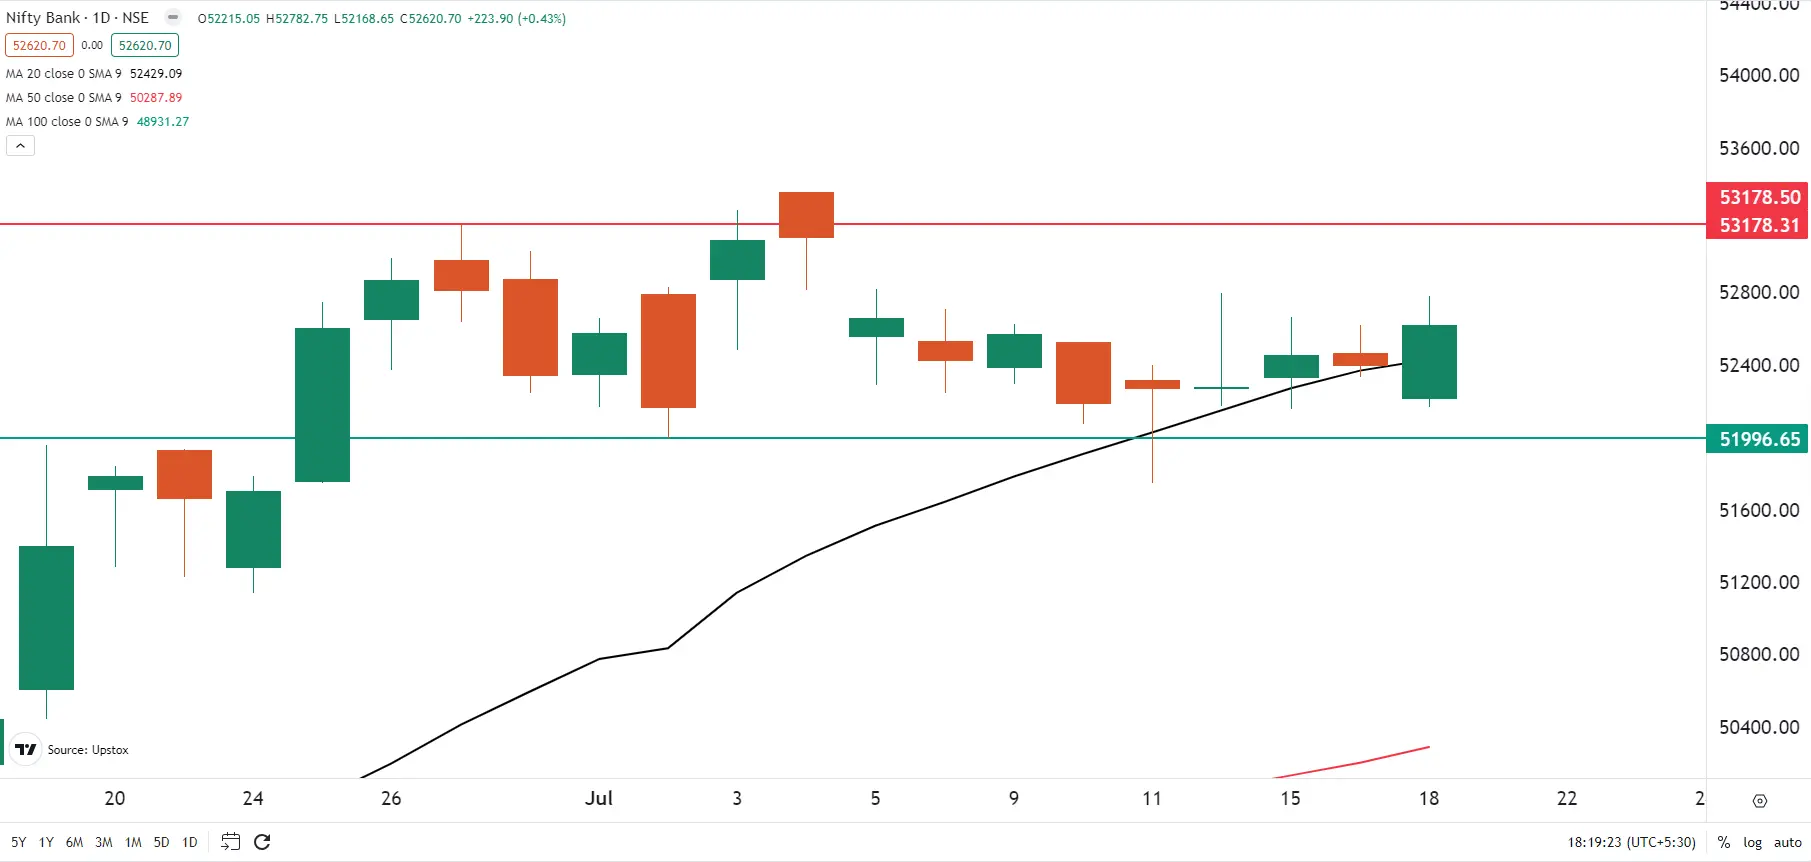
It is important to note that index heavyweights HDFC Bank and Kotak Mahindra Bank will announce their Q1 FY25 results on 20 July. The impact of the results will be felt on the index on Monday, 22 July.
The open interest (OI) data for the 24 July expiry has highest call and put OI at the 52,500 strike, indicating range-bound movement for the upcoming sessions. Traders should monitor the index's weekly close and changes in the OI to plan their strategies accordingly.
FII-DII activity
Stock scanner
Under F&O ban: Balrampur Chini Mills, Bandhan Bank, GMR Infra, Gujarat Narmada Valley Fertilisers & Chemicals, Hindustan Aeronautics, Hindustan Copper, India Cements, Piramal Enterprises, RBL Bank, Steel Authority of India and Vedanta
Out of F&O ban: Chambal Fertilisers
In Futures and Options or F&O, long build-up means an increase in Open Interest (OI) along with an increase in price, and short build-up means an increase in Open Interest(OI) along with a decrease in price.
Source: Upstox and NSE.
Disclaimer: Derivatives trading must be done only by traders who fully understand the risks associated with them and strictly apply risk mechanisms like stop-losses. The information is only for consumption by the client and such material should not be redistributed. We do not recommend any particular stock, securities and strategies for trading. The securities quoted are exemplary and are not recommendatory. The stock names mentioned in this article are purely for showing how to do analysis. Take your own decision before investing.
About The Author
Next Story


