Market News
Trade setup for 14 June: Trending move ahead for NIFTY50 and BANK NIFTY?
.png)
5 min read | Updated on June 14, 2024, 08:24 IST


SUMMARY
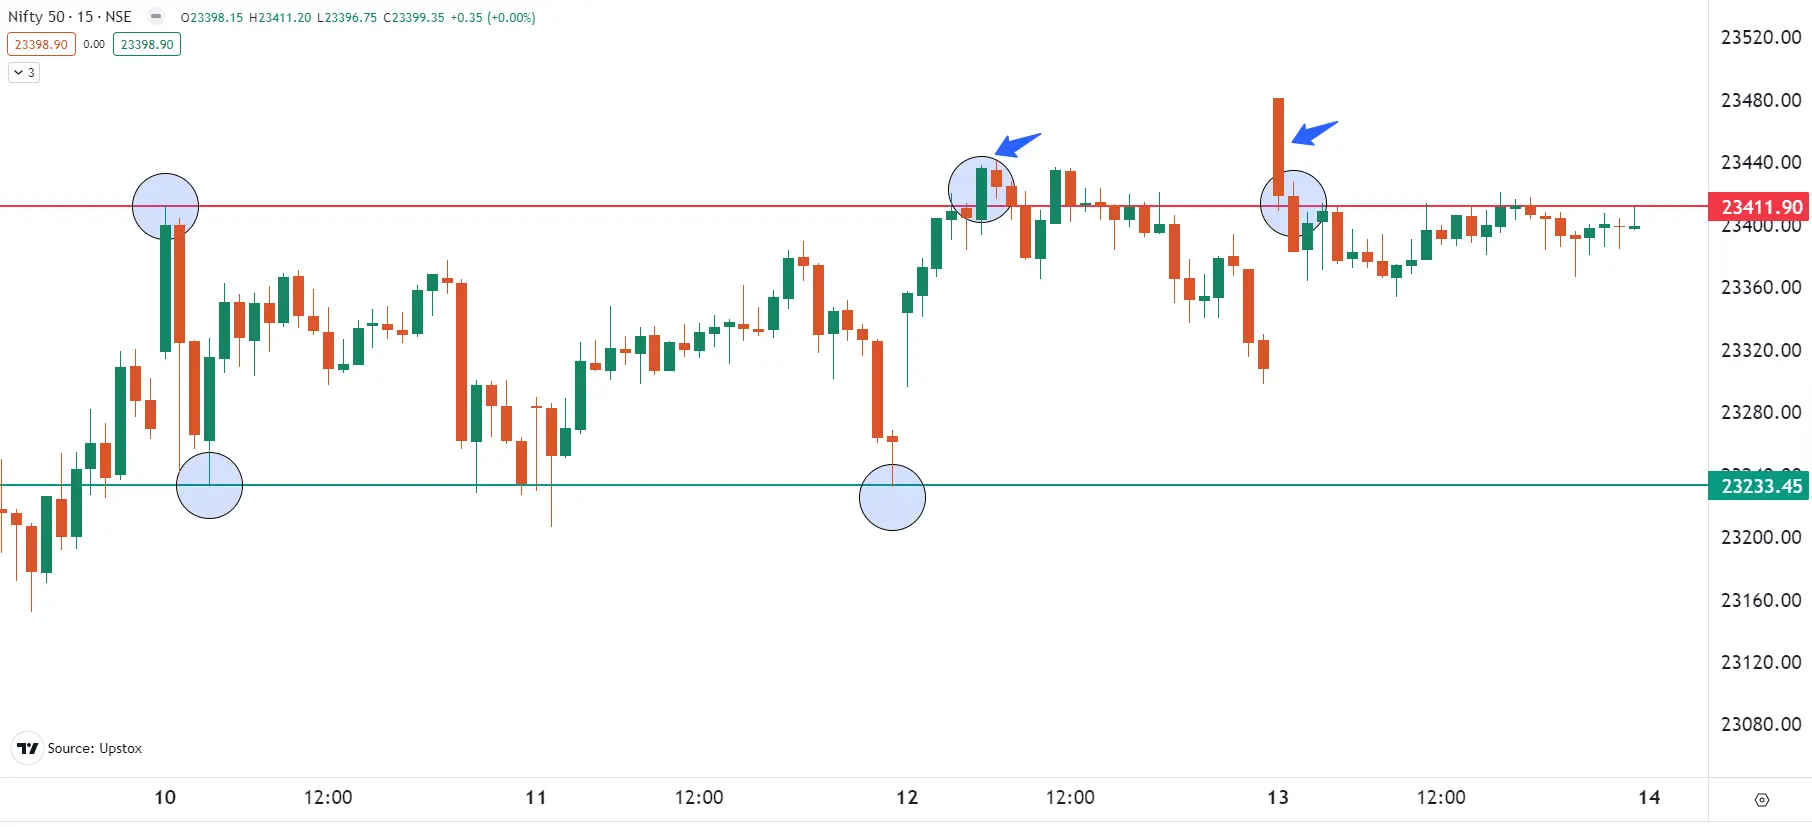
The NIFTY50 index has been trading within a narrow 300-point range over the past four days, failing to surpass the 23,400 mark. Traders should closely monitor the weekly close of the index. A close above 23,400 will signal bullish momentum, while a close below 23,400 will indicate weakness.

The NIFTY50 index hit a fresh all-time high and finished the weekly options expiry in the green.
Asian markets update 7 am
The GIFT NIFTY is trading flat, indicating a flat to positive start for Indian equities today. Meanwhile, Asian markets are also trading flat. Japan's Nikkei 225 is down 0.1%, while Hong Kong's Hang Seng Index is flat.
U.S. market update
- Dow Jones: 38,674 (▼0.1%)
- S&P 500: 5,433 (▲0.2%)
- Nasdaq Composite: 17,667 (▲0.3%)
U.S. stocks closed on the mixed note on Thursday led by gains in technology stocks. Moreover, the mixed results were reflected in the economic news. Initial jobless claims rose by 13,000 to 242,000, the highest level since August 2023. However, this was offset by a weaker than expected producer price index, which 0.2% in May against expectations for a rise of 0.1%.
NIFTY50
- June Futures: 23,399 (▲0.1%)
- Open Interest: 4,80,648 (▼2.8%)
The NIFTY50 index hit a fresh all-time high and finished the weekly options expiry in the green. The index extended its winning streak to a third consecutive day, but remained lacklustre throughout the day. Despite positive cues from global peers, the index failed to build on the gains and consolidated in a range of 128 points.
As the index continues to consolidate, based on our analysis of the 15 minute timeframe, we maintain the same setup and analysis. Yesterday the index attempted to break out of the range but once again faced rejection. In yesterday's blog, we emphasised to our readers that if the index could sustain a break above this range, they could plan their trades accordingly. However, the index encountered resistance in the first 15-minute candle and fell back into the consolidation zone. Traders can monitor this range closely, as a breakout of this range will provide further directional clues.
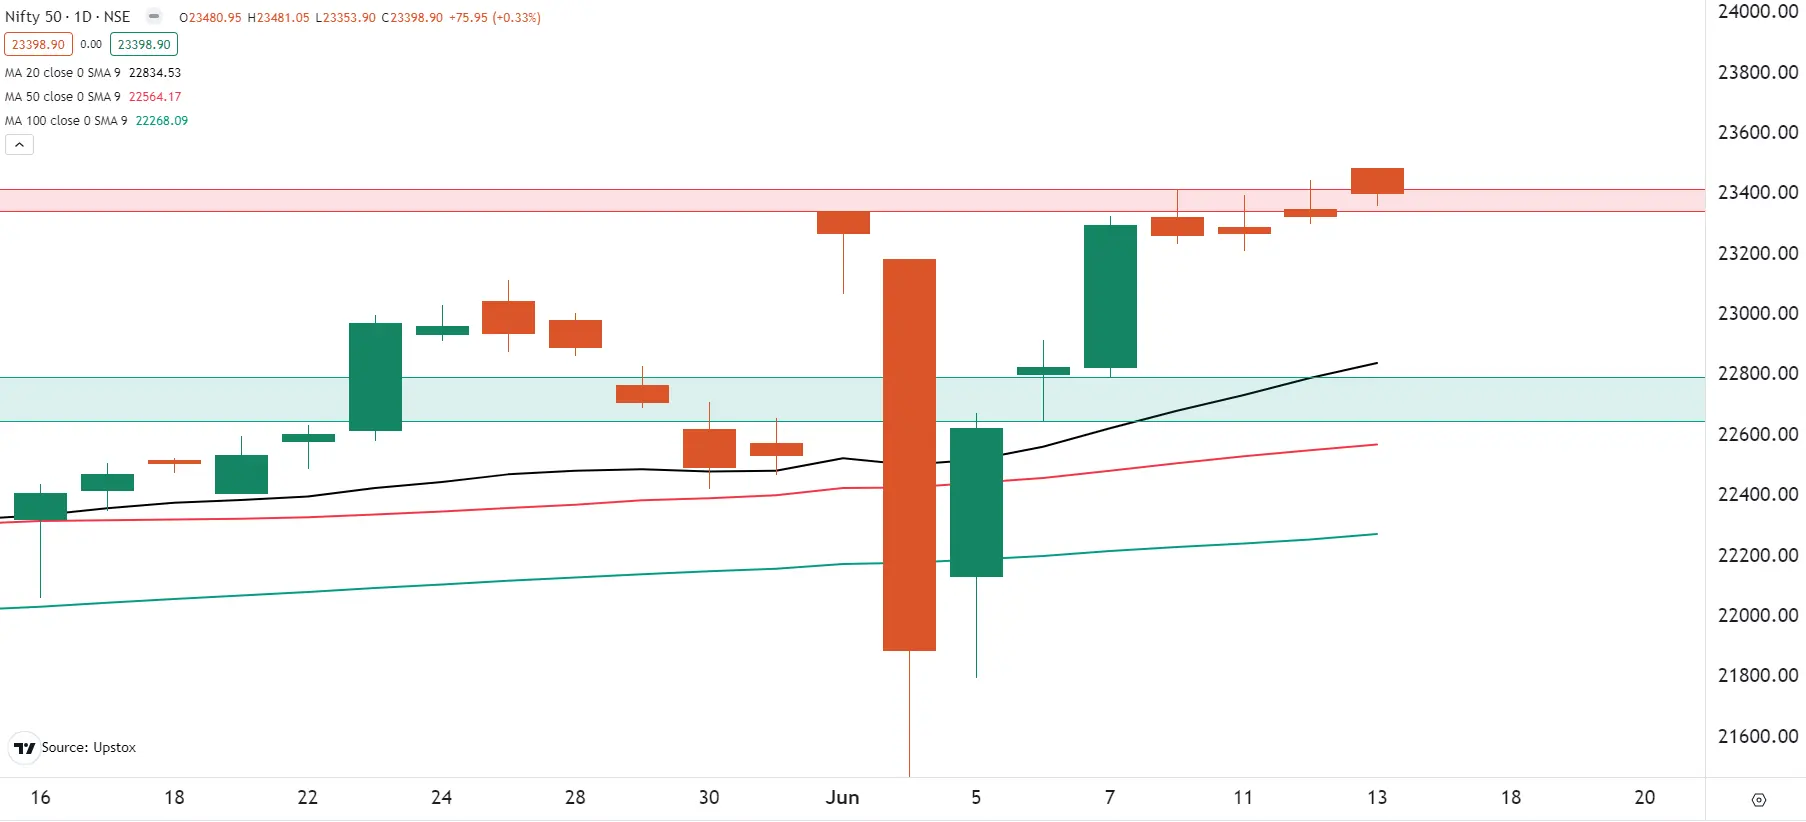
On the daily timeframe, the index has formed a bearish candlestick pattern known as a hanging man. However, this bearish reversal pattern will only be confirmed if today's close is below the closing price of the hanging man. Traders should monitor today's price action for confirmation of the hanging man pattern and also keep an eye on the weekly close. Interestingly, the weekly close is attempting to close above the previous week's high. If successful, this could negate the reversal pattern on the daily chart.
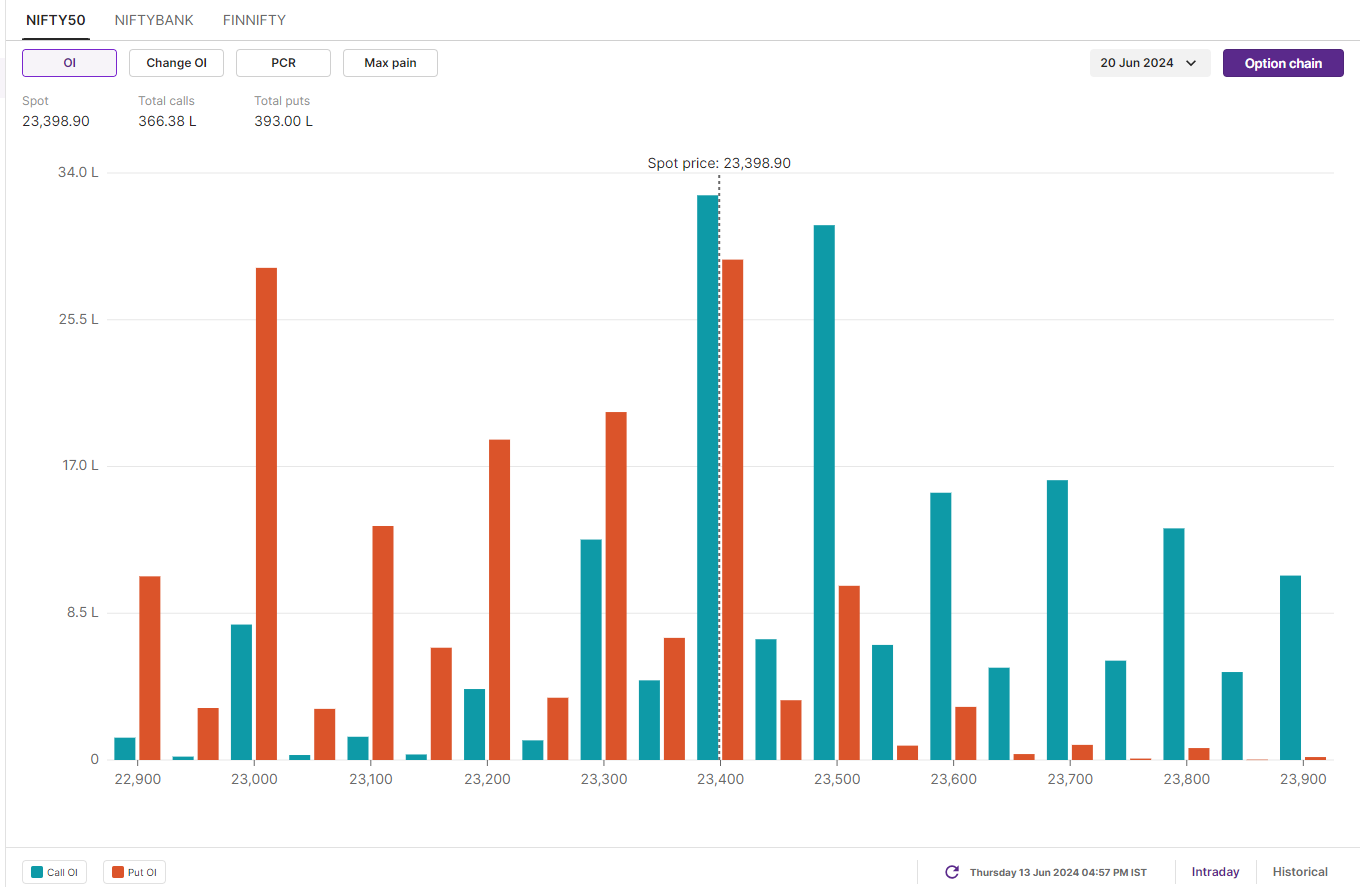
The initial open interest build-up for the 19 June expiry shows a scattered pattern, with significant call and put bases at the 23,400 strike. This is indicative of indecision and suggests range-bound activity. However, observing the price action near the weekly close, along with the change in the positioning of the open interest, will provide better clues for the coming trading sessions.
BANK NIFTY
- June Futures: 49,912 (▲0.02%)
- Open Interest: 1,55,208 (▼1.30%)
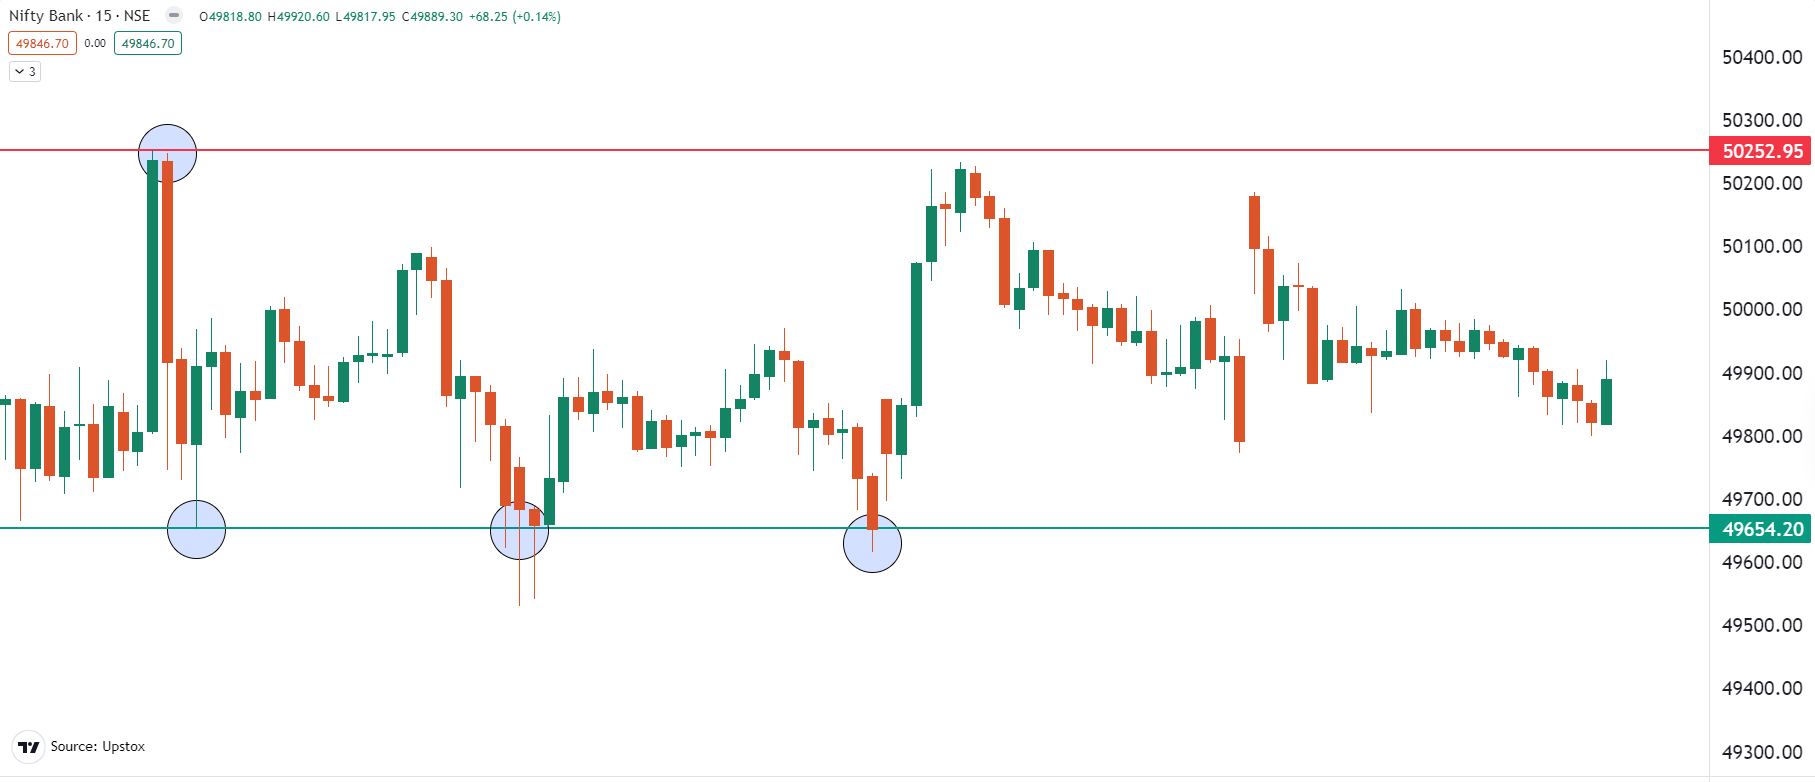
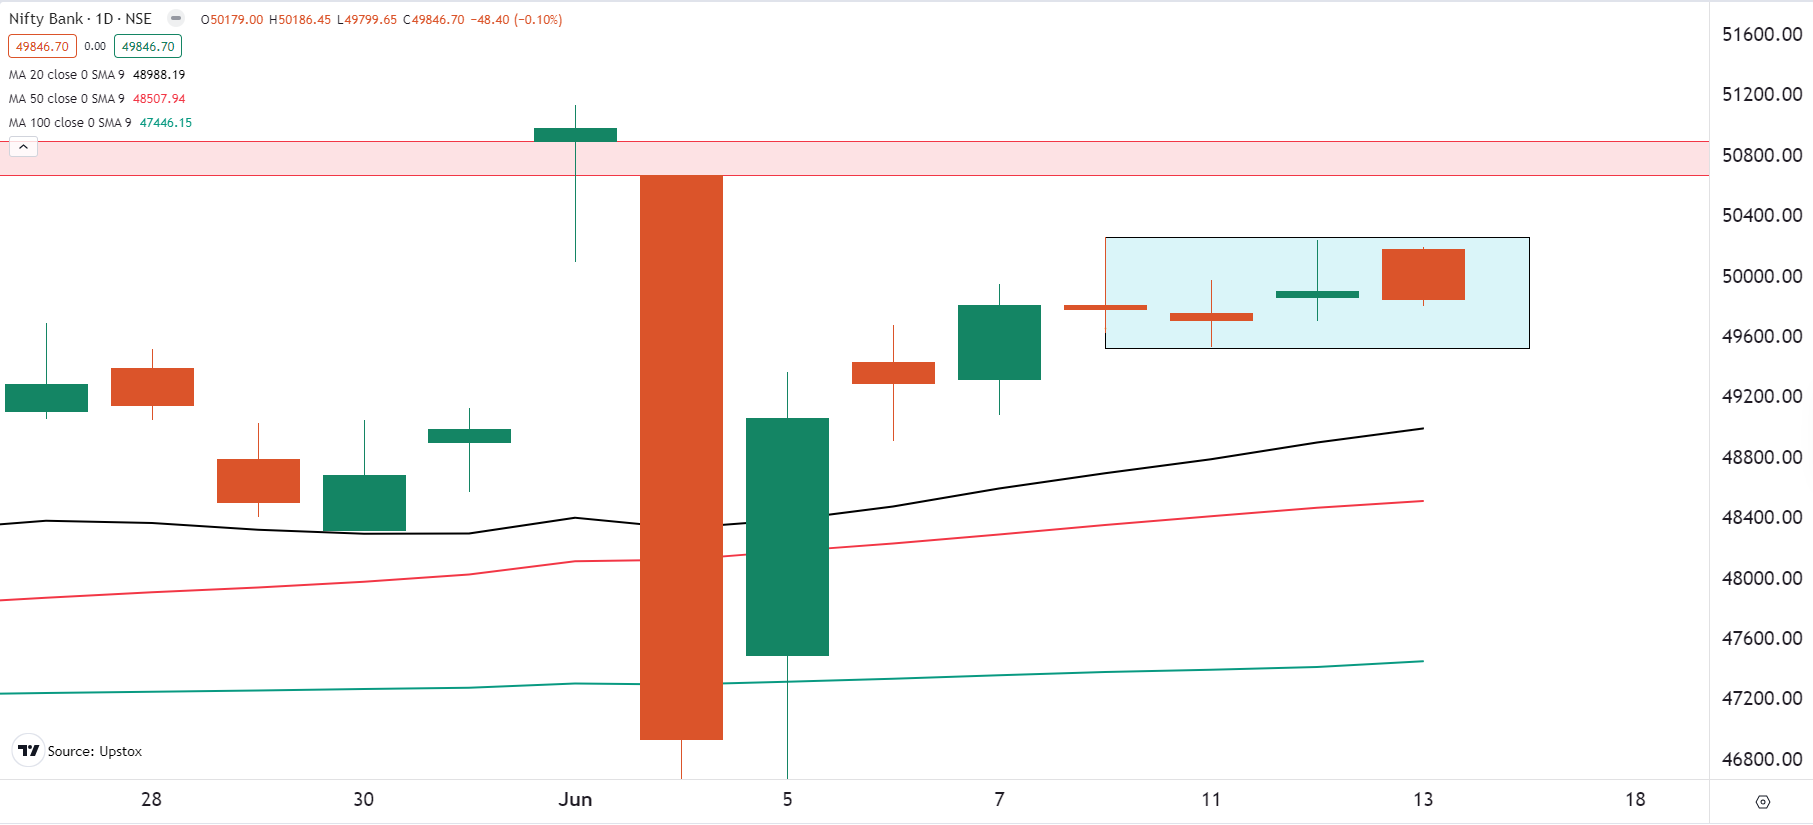
After a gap-up opening above the 50,000 level, the BANK NIFTY failed to hold on to its initial gains and fell back into the ongoing consolidation zone of the past four days, a range of nearly 700 points.
Following the approach taken with the NIFTY50, we will continue our analysis of the BANK NIFTY on the 15-minute timeframe. As noted in yesterday's blog post, the index is still consolidating within our identified trading zone, showing a lack of follow-through momentum. We advised our readers to remain cautious and to act once the index breaches this zone with momentum or on a closing basis. However, these levels and the consolidation zone remain crucial for our analysis. A breakout from this zone will offer further actionable insights into the upcoming trend.
Positionally on the daily chart, the index has is still trading above all its key daily moving averages (20 and 50), indicaiting that the broader trend of the index remains positive. However, traders can monitor the below highlighted consolidation zone. A break of this zone on intraday or closing basis will provide further clues.
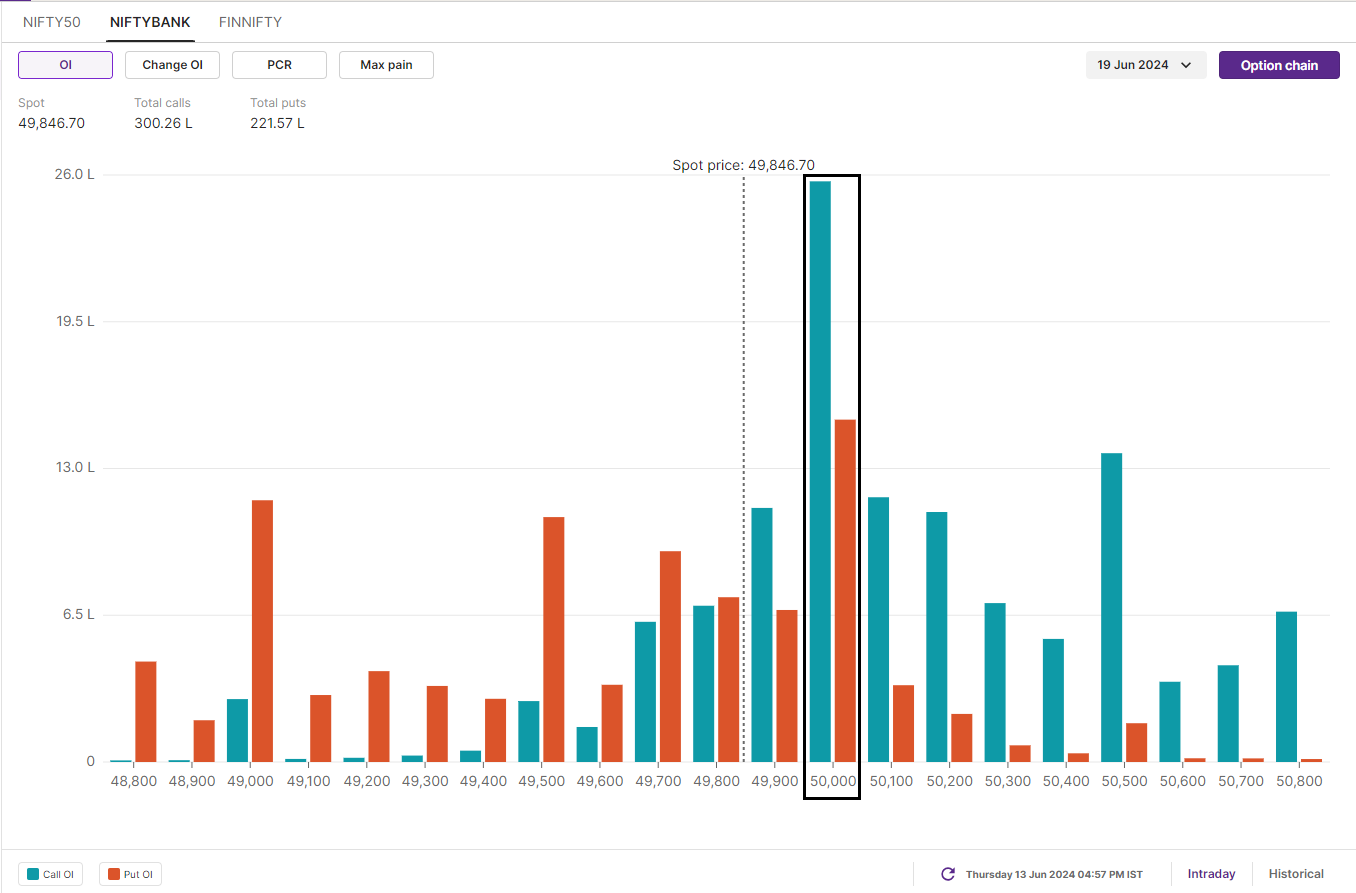
Open interest data for the June 19 expiry shows a significant call base at the 50,000 strike, indicating resistance around this area. On the other hand, the put base remains scattered from 50,000 to 49,000 strikes, indicating support for the index around these levels. This build-up broadly suggests range-bound activity for the index.
FII-DII activity
Stock scanner
Long build-up: Oracle Financial Services Software, Gujarat Gas, Dixon Technolgies, Godrej Properties and Icici Prudential
Short build-up: Marico and Sun Tv
Under F&O ban: GMR Airports Infrastructure, Hindustan Copper, India Cements, Steel Authority of India and Sun Tv
Out of F&O ban: Balrampur Chini Mills
In Futures and Options or F&O, long build-up means an increase in Open Interest (OI) along with an increase in price, and short build-up means an increase in Open Interest(OI) along with a decrease in price.
Source: Upstox and NSE.
Disclaimer: Derivatives trading must be done only by traders who fully understand the risks associated with them and strictly apply risk mechanisms like stop-losses. The information is only for consumption by the client and such material should not be redistributed. We do not recommend any particular stock, securities and strategies for trading. The securities quoted are exemplary and are not recommendatory. The stock names mentioned in this article are purely for showing how to do analysis. Take your own decision before investing.
About The Author
Next Story


