Market News
Trade setup for 11 June: Doji emerges on BANK NIFTY
.png)
4 min read | Updated on June 11, 2024, 07:51 IST


SUMMARY
The BANK NIFTY has formed a doji candlestick on the daily chart, indicating a pause and indecision among investors. For directional clues, traders can keep an eye on the low and high of the doji for further indications.
The formation of a doji on the daily chart marks a crucial moment
Asian markets update 7 am
The GIFT NIFTY (+0.2%) is trading in higher, suggesting a positive start for the Indian equities today. Meanwhile, major Asian indices are trading mixed. Japan’s Nikkei is up 0.2%, while the Hong Kong’s Hang Seng index is down 1.3%.
U.S. market update
- Dow Jones: 38,868 (▲0.1%)
- S&P 500: 5,360 (▲0.2%)
- Nasdaq Composite: 17,192 (▲0.3%)
U.S. stocks reversed earlier losses to end Monday's volatile session in the green. The S&P 500 and Nasdaq closed at record highs ahead of inflation data and the Federal Reserve meeting. Meanwhile, Apple shares fell after the company unveiled its long-awaited AI initiative called Apple Intelligence.
NIFTY50
- June Futures: 23,247 (▼0.4%)
- Open Interest: 4,90,140 (▼6.5%)
The NIFTY50 fell on 10 June, snapping a three-day winning streak, as investors focused on the impact of Prime Minister Narendra Modi's new cabinet of ministers and their portfolios after the swearing-in ceremony. The index witnessed profit-booking after hitting a fresh all-time high on the intraday basis.
In yesterday's analysis, we advised our readers to remain cautious on potential profit taking after the index rallied over 9% from the previous week's low. Despite the recent profit-taking, the experts maintain that the broader trend for the index remains positive as long as it trades above its 20-day moving average. According to their price action analysis, any dip towards the 22,800-22,700 area could attract buyers to re-enter the market.
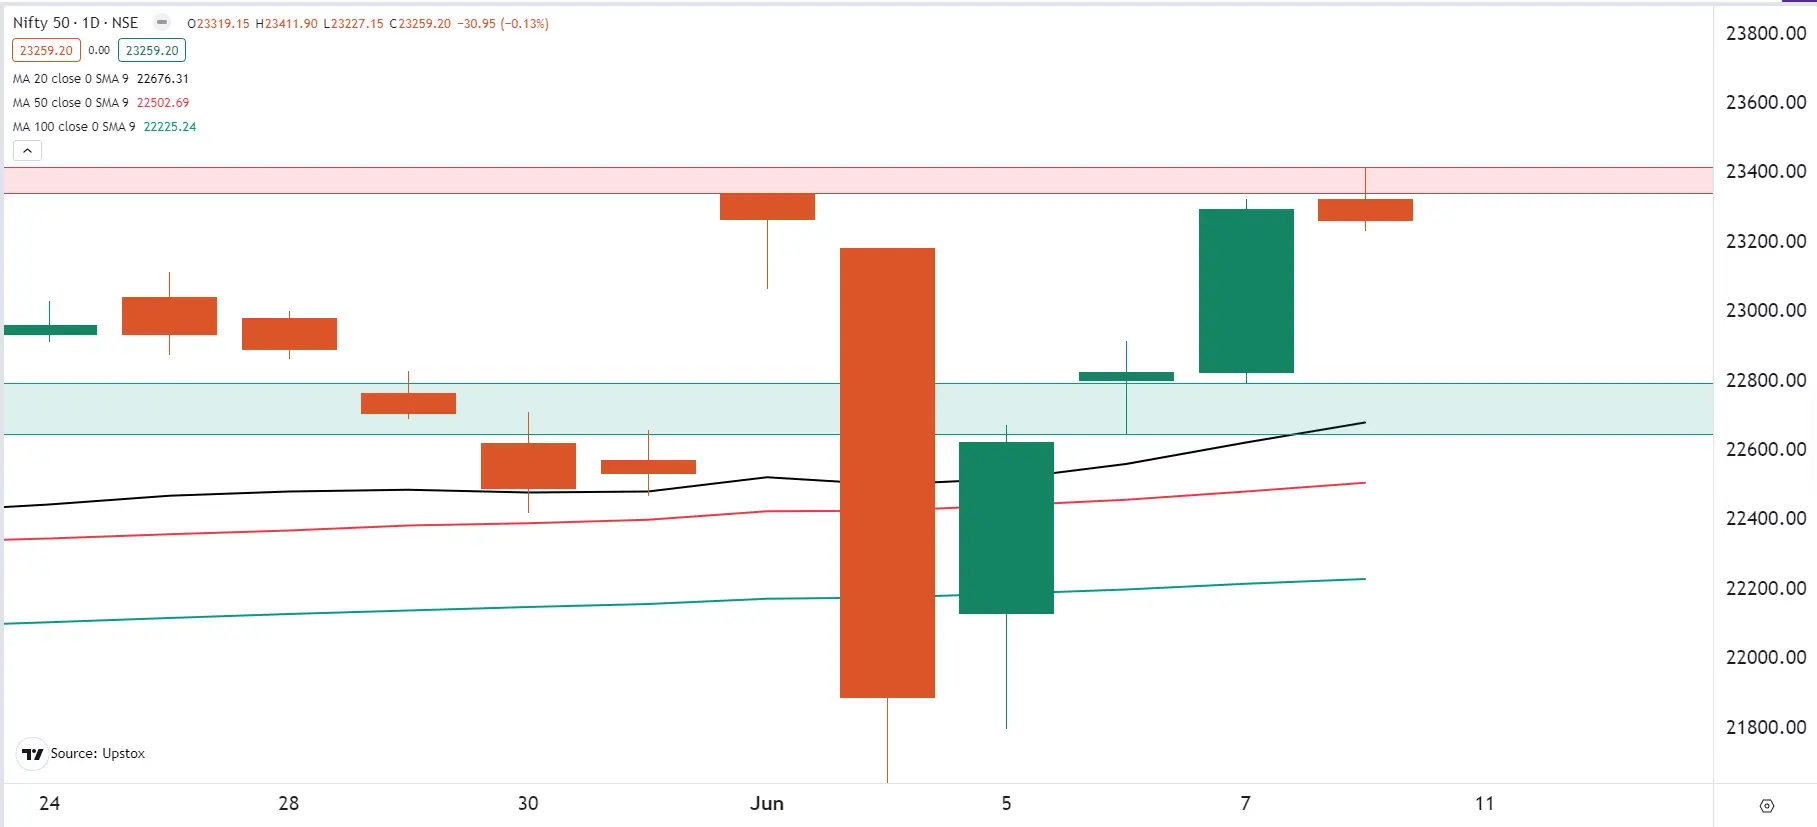
Moreover, the open interest data indicates the index is hovering between 23,000 and 23,500 range. For the 13 June expiry, there is a significant put base at 23,000 strike, while the call open interest is concentrated at the 23,500 strike. Traders should monitor the price action around these levels and any unwinding of open interest at these strikes to gauge further directional clues.
BANK NIFTY
- June Futures: 49,732 (▼0.5%)
- Open Interest: 1,64,923(▼6.6%)
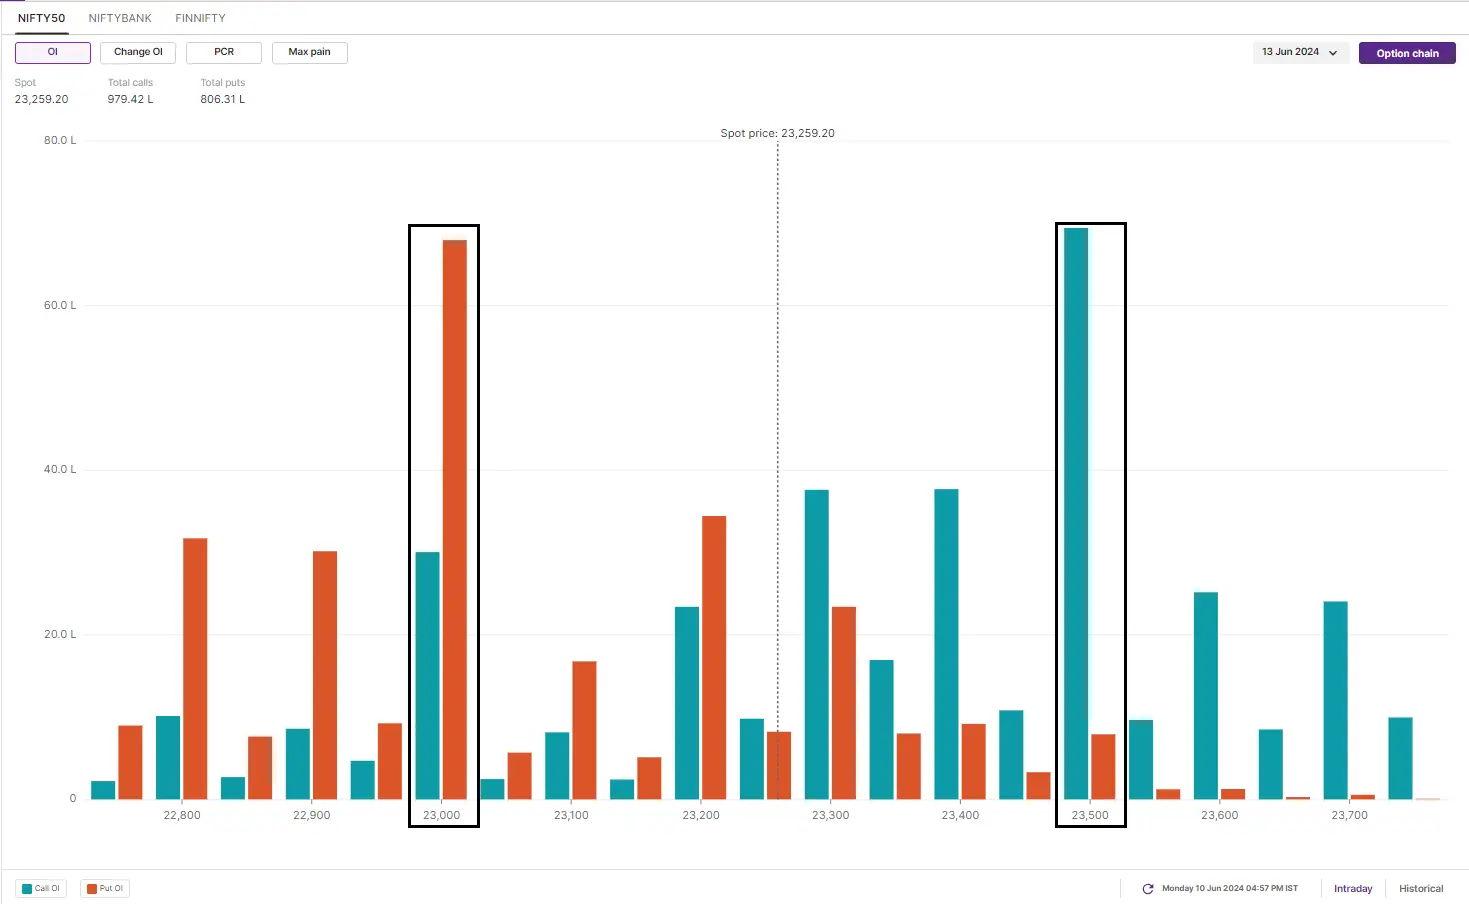
After a flat start, the BANK NIFTY jumped above the 50,000 level but failed to hold on to the opening gains. The index came under selling pressure at higher levels and traded sideways for the second half of the session, forming a doji candle on the daily chart.
The formation of a doji on the daily chart marks a crucial moment, as the high and low of this neutral pattern will be key levels to watch. Traders are advised to monitor the break of the doji's high and low on both an intraday and closing basis for further directional clues. For today's session, immediate support for the index is found at the 20-day moving average (DMA) at 48,300, while resistance is found at the 50,200 level.
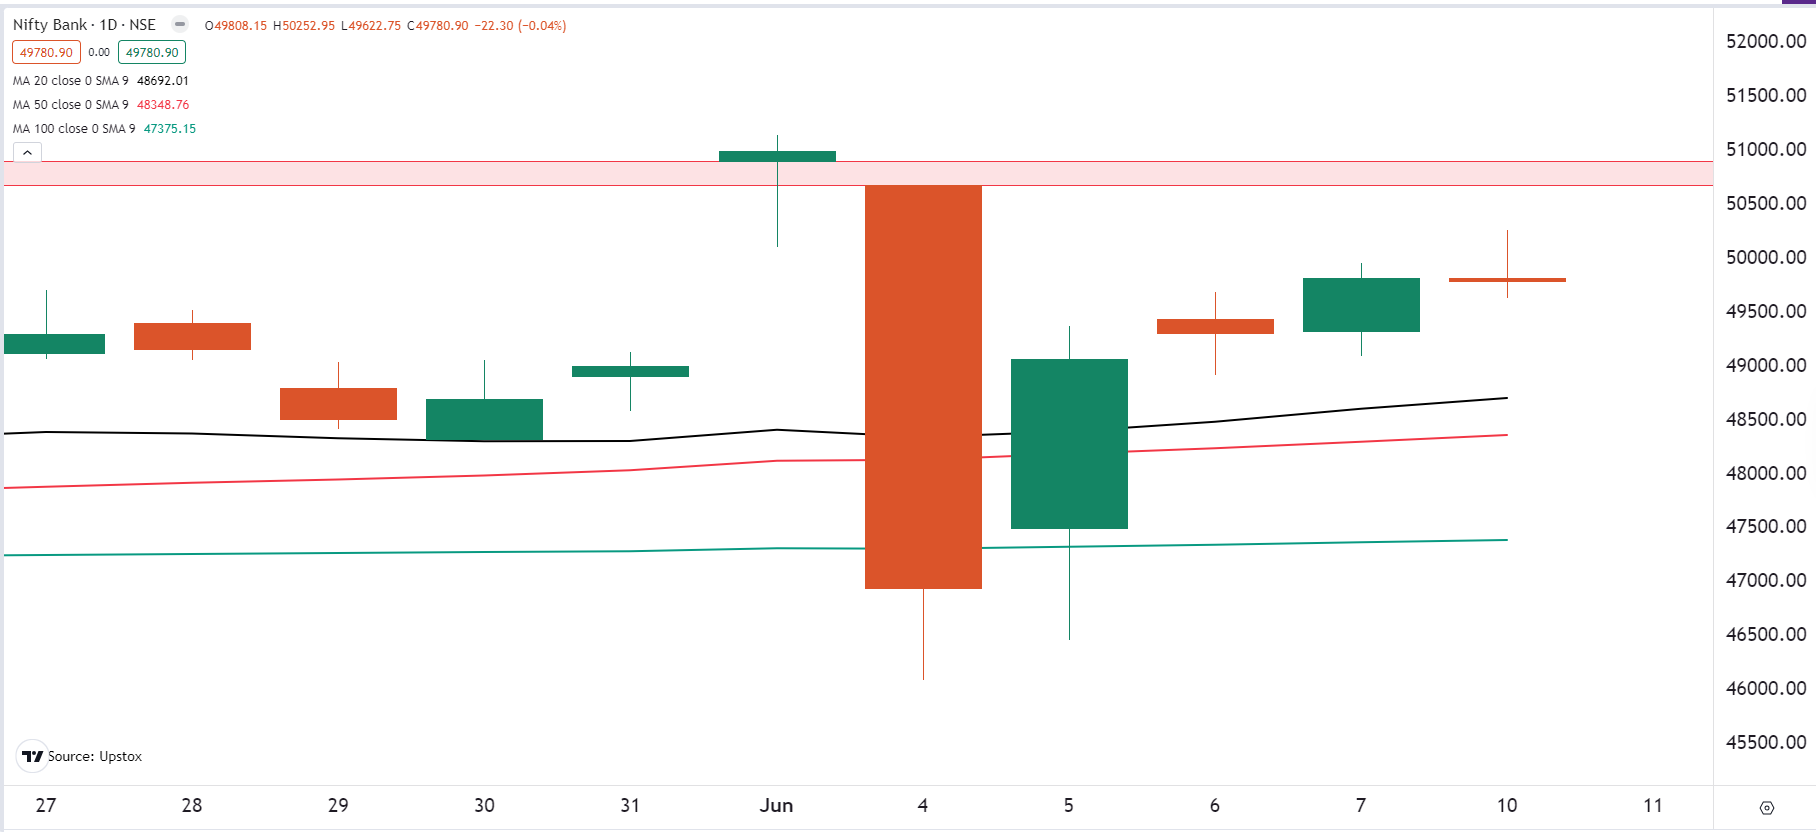
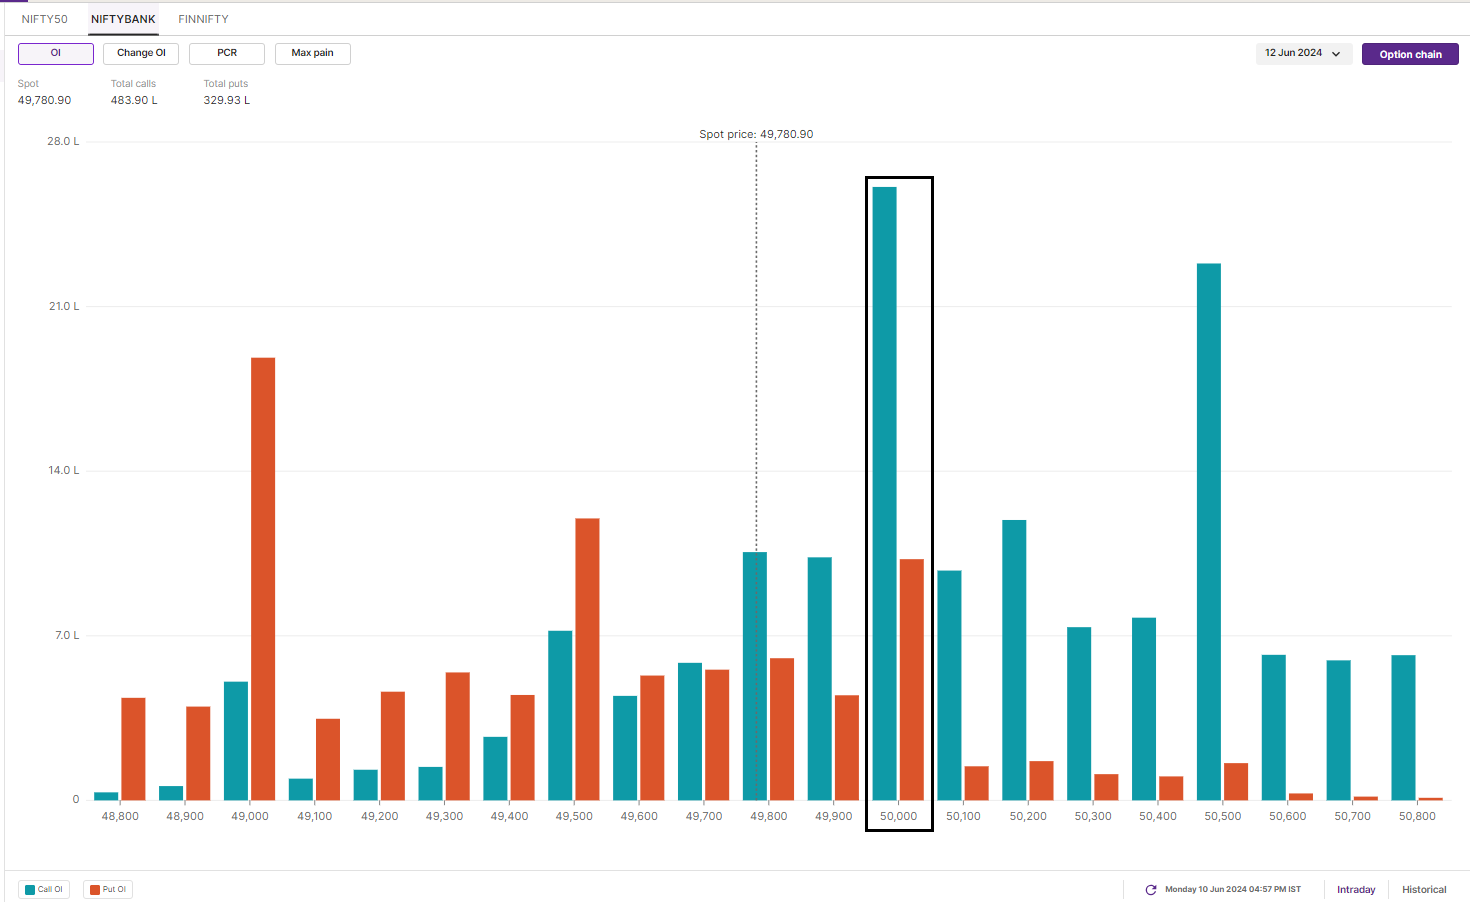
The open interest (OI) analysis of the 12 June expiry has the significant call OI at 50,000 and 51,000 strikes. On the flip side, the significant put OI was accumulated at 49,000 and 48,000 strikes.
FII-DII activity
Stock scanner
Long build-up: Interglobe Aviation (Indigo), Ramco Cements, Ultratech Cement, United Breweries and Coromandel International
Short build-up: Coforge, Mphasis, GAIL, Wipro and Jindal Steel
Under F&O ban: Balrampur Chini Mills, India Cements, Steel Authority of India and Zee Entertainment
In Futures and Options or F&O, long build-up means an increase in Open Interest (OI) along with an increase in price, and short build-up means an increase in Open Interest(OI) along with a decrease in price.
Source: Upstox and NSE.
Disclaimer: Derivatives trading must be done only by traders who fully understand the risks associated with them and strictly apply risk mechanisms like stop-losses. The information is only for consumption by the client and such material should not be redistributed. We do not recommend any particular stock, securities and strategies for trading. The securities quoted are exemplary and are not recommendatory. The stock names mentioned in this article are purely for showing how to do analysis. Take your own decision before investing.
About The Author
Next Story