Upstox Securities Pvt. Ltd.: SEBI Registration No. INZ000315837 | NSE TM Code: 13942 | BSE TM Code: 6155 | CDSL Reg No.: IN-DP-761-2024 | CIN: U65100DL2021PTC376860 | Compliance Officer: Mr. Kapil Jaikalyani. Tel No.: (022) 24229920. Email ID: compliance@upstox.com | Registered Address: 809, New Delhi House, Barakhamba Road, Connaught Place, New Delhi - 110001 | RKSV Commodities India Pvt. Ltd.: SEBI Registration No.: INZ000015837 | MCX TM Code: 46510 | CIN: U74900DL2009PTC189166 | Compliance Officer: Mr. Amit Lalan. Tel No.: (022) 24229920. Email ID: compliance@rksv.in | Registered Address: 807, New Delhi House, Barakhamba Road, Connaught Place, New Delhi - 110001. Correspondence Address: 30th Floor, Sunshine Tower, Senapati Bapat Marg, Dadar (West), Mumbai - 400013. | For any complaints, email at complaints@upstox.com and complaints.mcx@upstox.com.
Procedure to file a complaint on SEBI SCORES: Register on the SCORES portal. Mandatory details for filing complaints on SCORES include: Name, PAN, Address, Mobile Number, and E-mail ID. Benefits include effective communication and speedy redressal of grievances. Please ensure you carefully read the Risk Disclosure Document as prescribed by SEBI, along with our Terms of Use and Privacy Policy.
Upstox Securities Private Limited is a wholly owned subsidiary of RKSV Securities India Private Limited and RKSV Commodities India Private Limited is an associate of RKSV Securities India Private Limited.
Disclaimer: Investment in securities market are subject to market risks, read all the related documents carefully before investing.
*Brokerage will not exceed the SEBI prescribed limit.
Risk disclosures on derivatives -
- 9 out of 10 individual traders in equity Futures and Options Segment, incurred net losses.
- On an average, loss makers registered net trading loss close to ₹ 50,000
- Over and above the net trading losses incurred, loss makers expended an additional 28% of net trading losses as transaction costs.
- Those making net trading profits, incurred between 15% to 50% of such profits as transaction cost.
Mutual Funds: Top rated funds do not constitute any advice. Research data is powered by Morningstar. Please read the offer documents carefully before investing. Upstox shall not accept any liability arising out of your investments.
These are not Exchange traded products, and the Member is just acting as distributor. All disputes with respect to the distribution activity, would not have access to Exchange investor redressal forum or Arbitration mechanism.
Attention Investors: As per NSE circular dated July 6, 2022, BSE circular dated July 6, 2022, MCX circular dated July 11, 2022 investors are cautioned to abstain them from dealing in any schemes of unauthorised collective investments/portfolio management, indicative/ guaranteed/fixed returns / payments etc. Investors are further cautioned to avoid practices like:
a) Sharing i) trading credentials – login id & passwords including OTP’s., ii) trading strategies, iii) position details.
b) Trading in leveraged products /derivatives like Options without proper understanding, which could lead to losses.
c) Writing/ selling options or trading in option strategies based on tips, without basic knowledge & understanding of the product and its risks.
d) Dealing in unsolicited tips through platforms like Whatsapp, Telegram, Instagram, YouTube, Facebook, SMS, calls, etc.
e) Trading / Trading in “Options” based on recommendations from unauthorised / unregistered investment advisors and influencers.
Kindly, read the Advisory Guidelines For Investors as prescribed by the Exchange with reference to their circular dated 27th August, 2021 regarding investor awareness and safeguarding client’s assets: Advisory Guidelines For Investors
Kindly, read the advisory as prescribed by the Exchange with reference to their circular dated January 14, 2022 regarding Updation of mandatory KYC fields by March 31, 2022: KYC Updation
Attention Investors: Prevent unauthorised transactions in your Demat account by updating your mobile number with your depository participant. Receive alerts on your registered mobile number for debit and other important transactions in your Demat account directly from CDSL on the same day. Prevent unauthorised transactions in your Trading account by updating your mobile numbers/email addresses with your stock brokers. Receive information on your transactions directly from the Exchange on your mobile/email at the end of the day. Issued in the interest of investors. KYC is a one-time exercise while dealing in securities markets - once KYC is done through a SEBI-registered intermediary (broker, DP, Mutual Fund, etc.), you need not undergo the same process again when you approach another intermediary. As a business, we don’t give stock tips and have not authorised anyone to trade on behalf of others. If you find anyone claiming to be part of Upstox or RKSV and offering such services, please send us an email at complaints@upstox.com and complaints.mcx@upstox.com.
No need to issue cheques by investors while subscribing to IPO. Just write the bank account number and sign in the application form to authorise your bank to make payment in case of allotment. No worries for refund as the money remains in investor’s account. Stockbrokers can accept securities as margin from their clients only by way of a pledge in the depository system w.e.f. 1st September 2020.
Update your email ID and mobile number with your stockbroker/depository participant and receive an OTP directly from the depository on your registered email ID and/or mobile number to create a pledge.
Check your securities/mutual funds/bonds in the Consolidated Account Statement (CAS) issued by NSDL/CDSL every month.
Attention Investors: SEBI has established an Online Dispute Resolution Portal (ODR Portal) for resolving disputes in the Indian Securities Market. This circular streamlines the existing dispute resolution mechanism, offering online conciliation and arbitration, benefiting investors and listed companies. https://www.sebi.gov.in/legal/circulars/jul-2023/online-resolution-of-disputes-in-the-indian-securities-market_74794.html ODR portal for Investors - https://smartodr.in/login


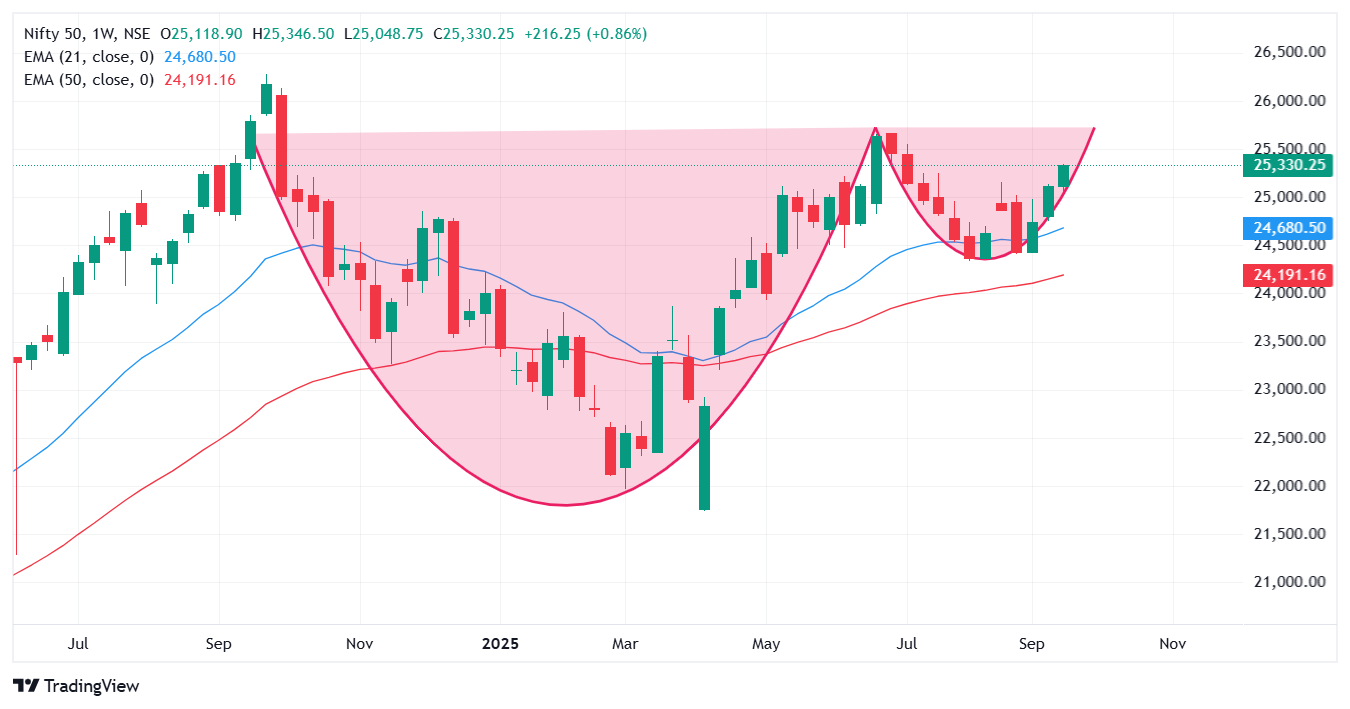
 On the weekly charts, NIFTY50 is on the verge of forming a cup-and-handle candlestick pattern, indicating a breakout from the current long-term consolidation. According to the experts, the breakout could confirm with a weekly close above 25,600 levels on the NIFTY50.
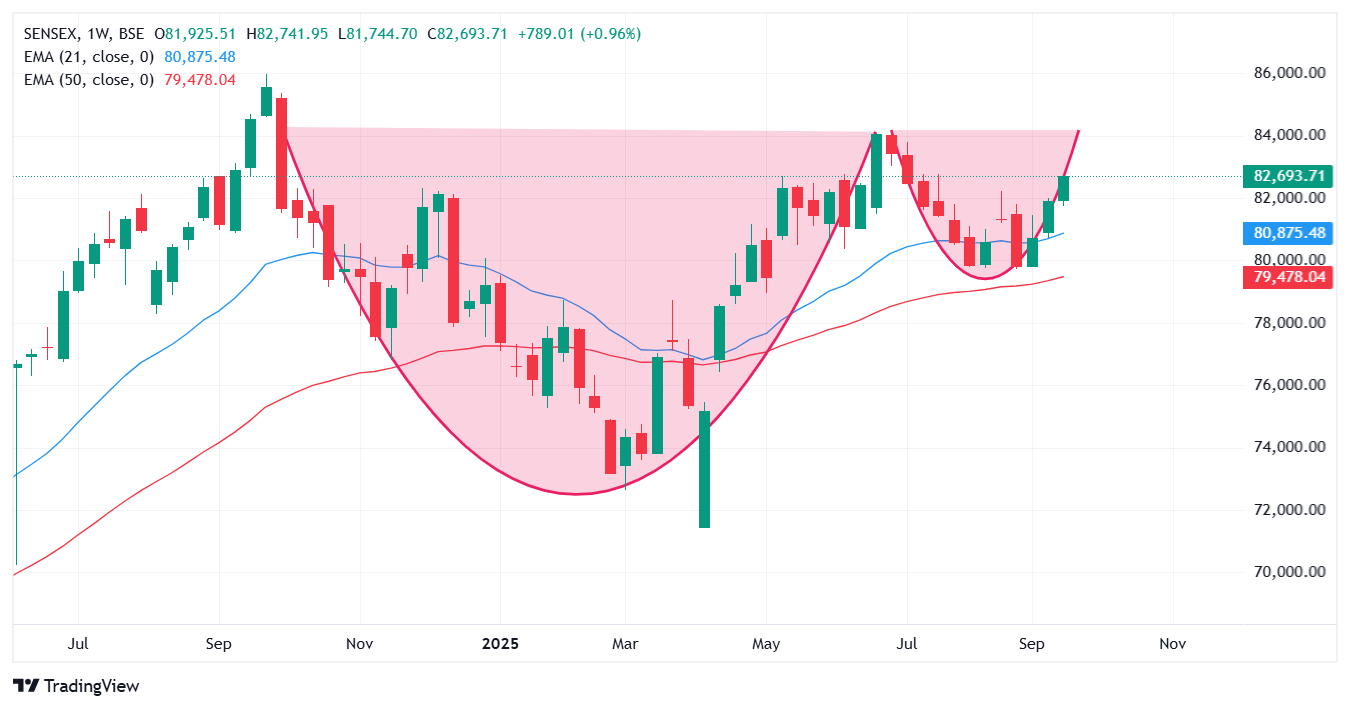
 Similar to NIFTY50, SENSEX is also forming a cup & handle candlestick pattern on weekly charts. Experts believe that the breakout would be confirmed if the index closes above the 84,200 levels on a weekly basis.
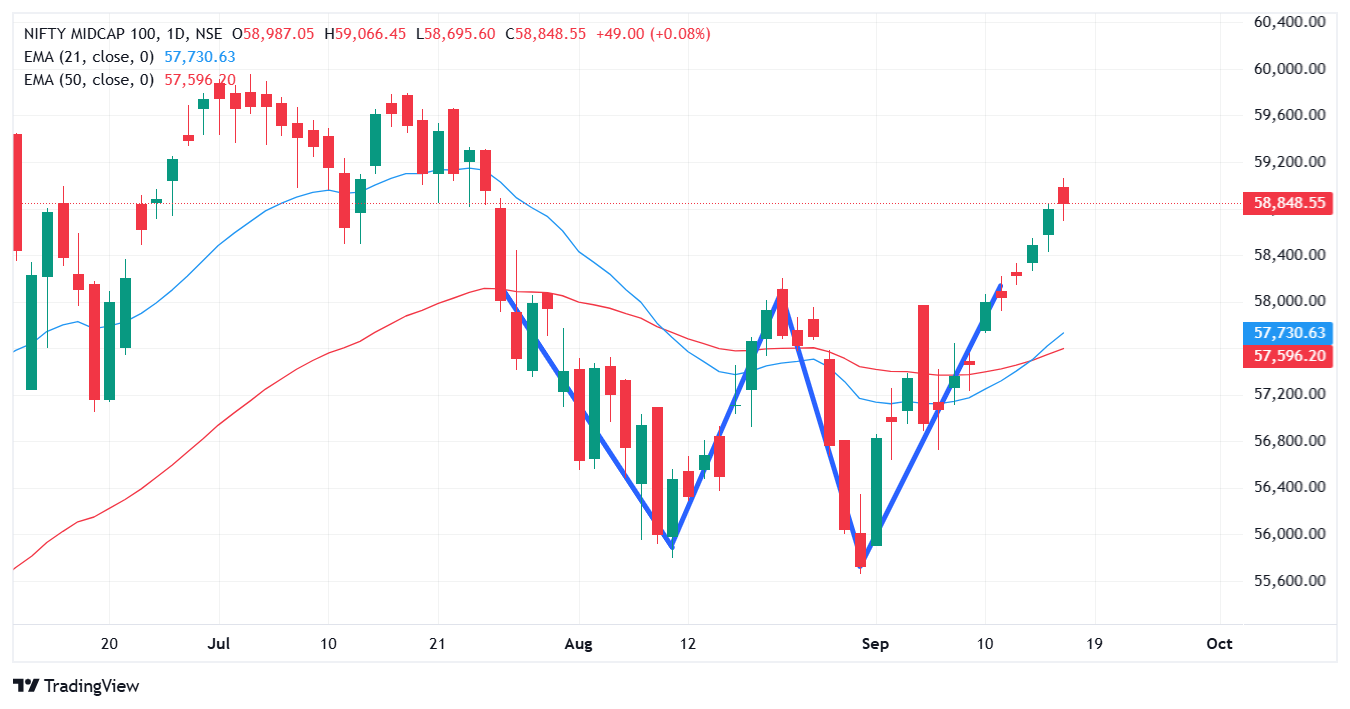
 This broader market index on the chart indicates a double bottom candlestick pattern, which indicates a reversal to a bullish trend. On daily charts, we also witnessed a positive crossover of the 21 EMA crossing the 50 EMA, indicating further sustained momentum.
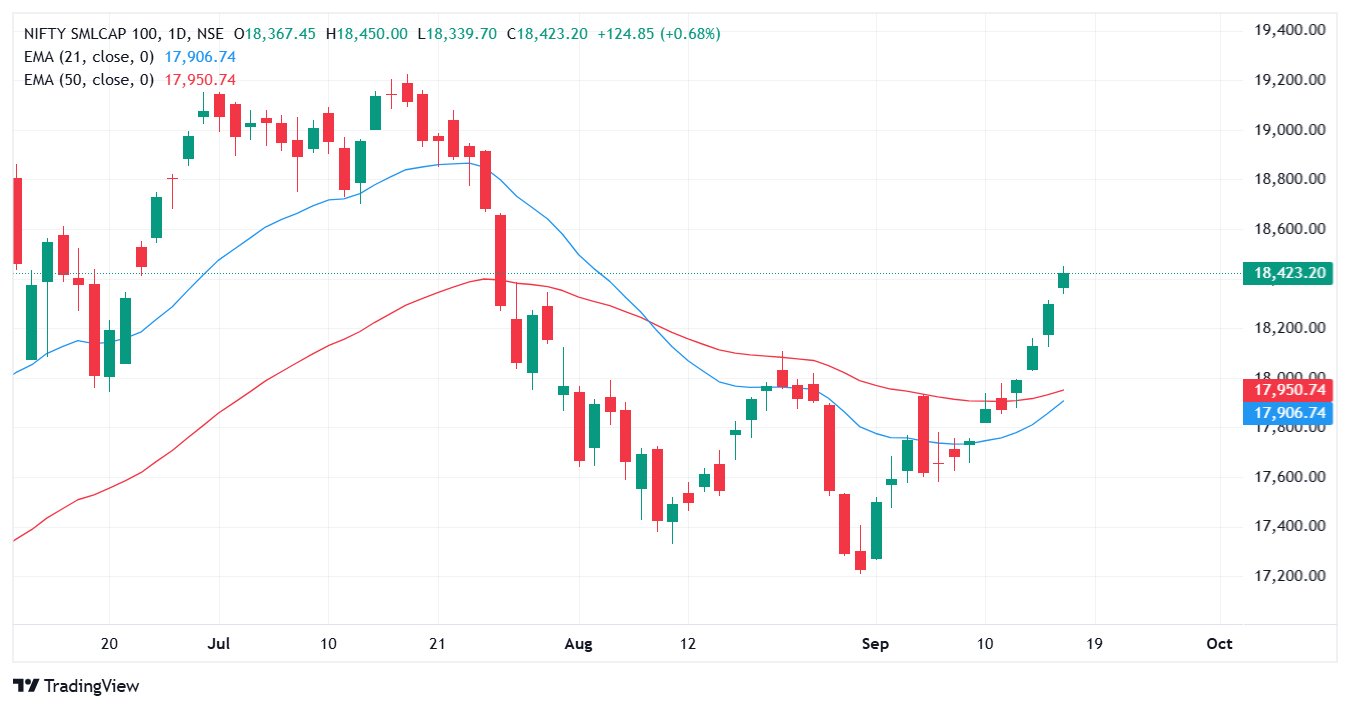
 The small-cap index is on the verge of posting a positive crossover of 21 EMA crossing 50 EMA from below, indicating sustained bullish momentum in the index. The index has been highly underperforming the benchmark and currently trades nearly 6% lower than its record high levels last touched in December 2024.
