Market News
Markets in the week ahead: NIFTY50's range-bound trend expected in holiday-shortened week
.png)
6 min read | Updated on June 17, 2024, 22:38 IST


SUMMARY
The volatility index plummeted over 24% last week, offering much-needed relief to the bulls. With options premiums cooling down, traders are anticipating range-bound activity in the NIFTY50 index in the upcoming sessions.

Last week, the NIFTY Midcap100 index surged nearly 4% to a record high
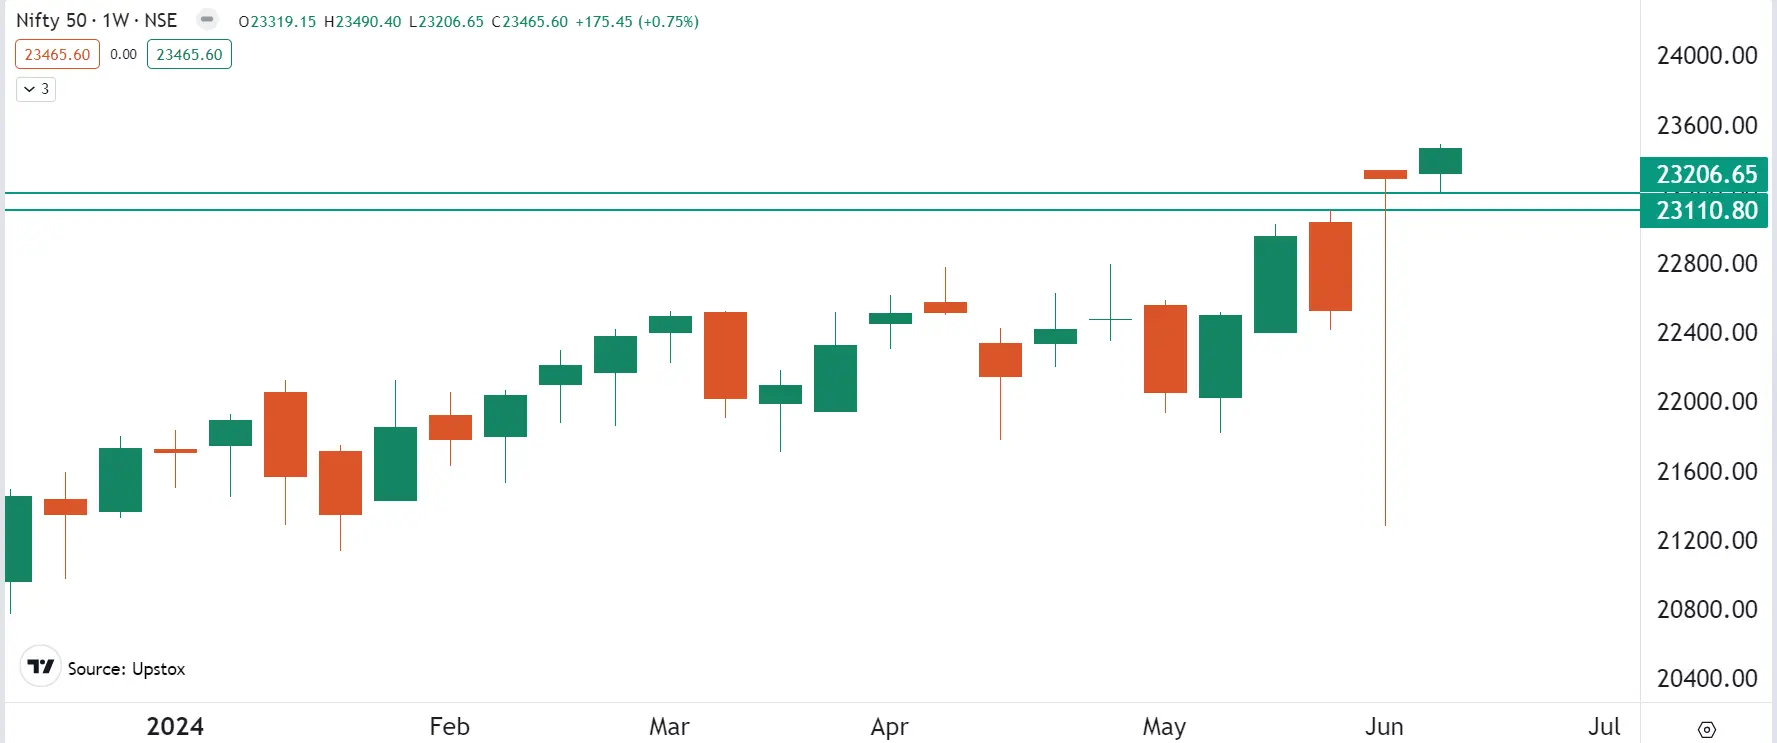
Markets traded in a narrow range throughout the week, closing in positive territory for the second week in a row. The NIFTY50 index recovered from its election week losses to touch a fresh all-time high and ended the week at 23,465, up 0.7%. Meanwhile, the SENSEX also closed in the green and closed at 76,992, up 0.3%.
The real excitement, however, was in the broader markets. The NIFTY Midcap100 index surged nearly 4% to a record high, while the Smallcap 100 index climbed almost 5%, also reaching a new peak. This robust performance followed sharp falls of over 11% and 14% for the Midcap and Smallcap indices respectively on the day of the election results.
In terms of sectors, all indices closed in the green except for FMCG, which was down 1.2%. Real estate and consumer durables led the way with gains of 5.5% and 6.3% respectively.
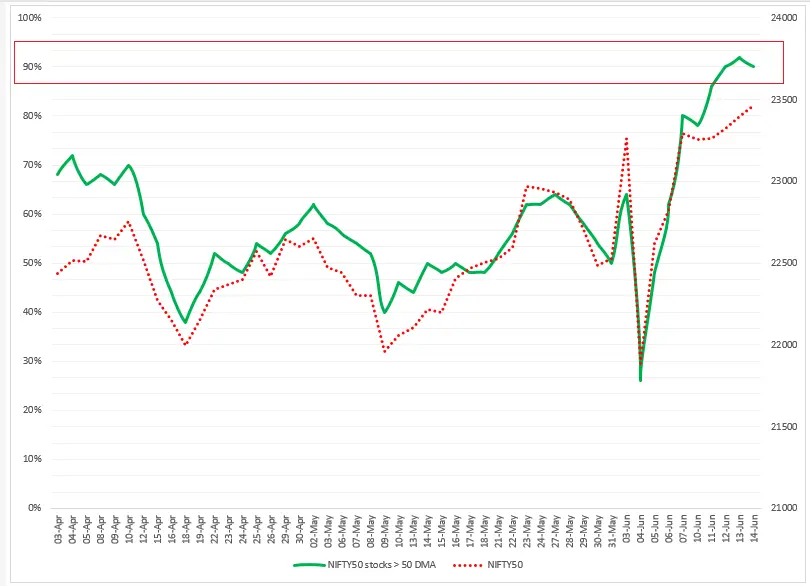
Index breadth- NIFTY50
In last week's blog, the breadth indicator for NIFTY50 stocks trading above their 50-day moving average (DMA) was at 80%. We advised our readers that the reading could rise towards 90%, but that they should remain cautious as a reading above 90% could lead to a profit-booking scenario in the coming sessions.
During the past week, the breadth indicator reached 90% and is currently stationed at this level. This means that 90% of the NIFTY50 stocks are trading above their 50-day moving average. For the week ahead, traders should remain cautious of potential profit-taking and expect consolidation with a positive bias.
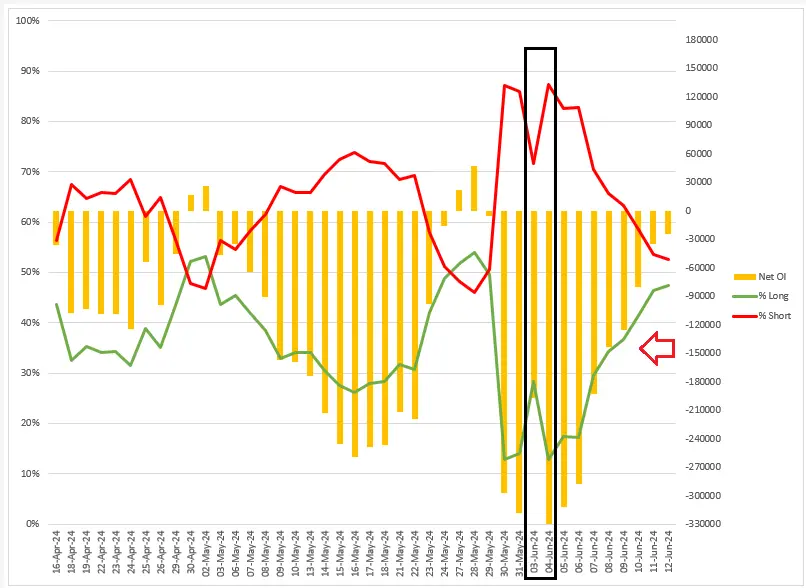
FIIs positioning in the index
The current net open interest (OI) of Foreign Institutional Investors (FIIs) in the Index Futures stands at -24,415 contracts. This translates into a long-to-short ratio of 47:53, an improvement from last week's 30:70.
Recalling last week's analysis of FIIs net OI, we reminded our readers of the importance of paying close attention to the unwinding of net open interest. As shown in the chart below, after reaching an extreme ratio of 13:87 on election day, FIIs have now significantly reduced their short OI. This has resulted in the index consolidating and moving higher over the past week.
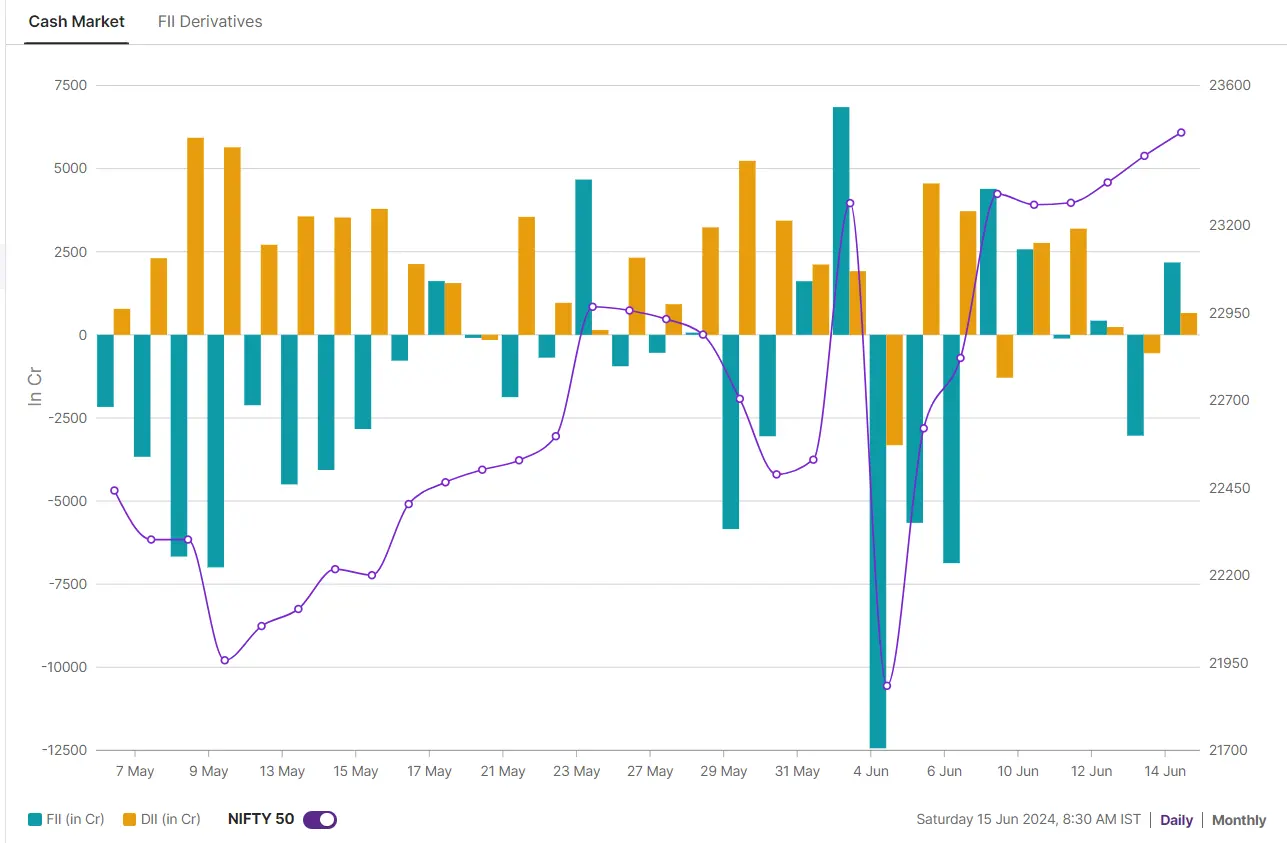
The positioning of the futures was in line with the cash market activity of the FIIs. FIIs turned net buyers last week and bought shares worth ₹2,030 crore. The domestic institutional investors remained net buyers and purchased shares worth ₹6,293 crore on a net basis, resulting in a net inflow of ₹8,323 crore.
F&O - NIFTY50 outlook
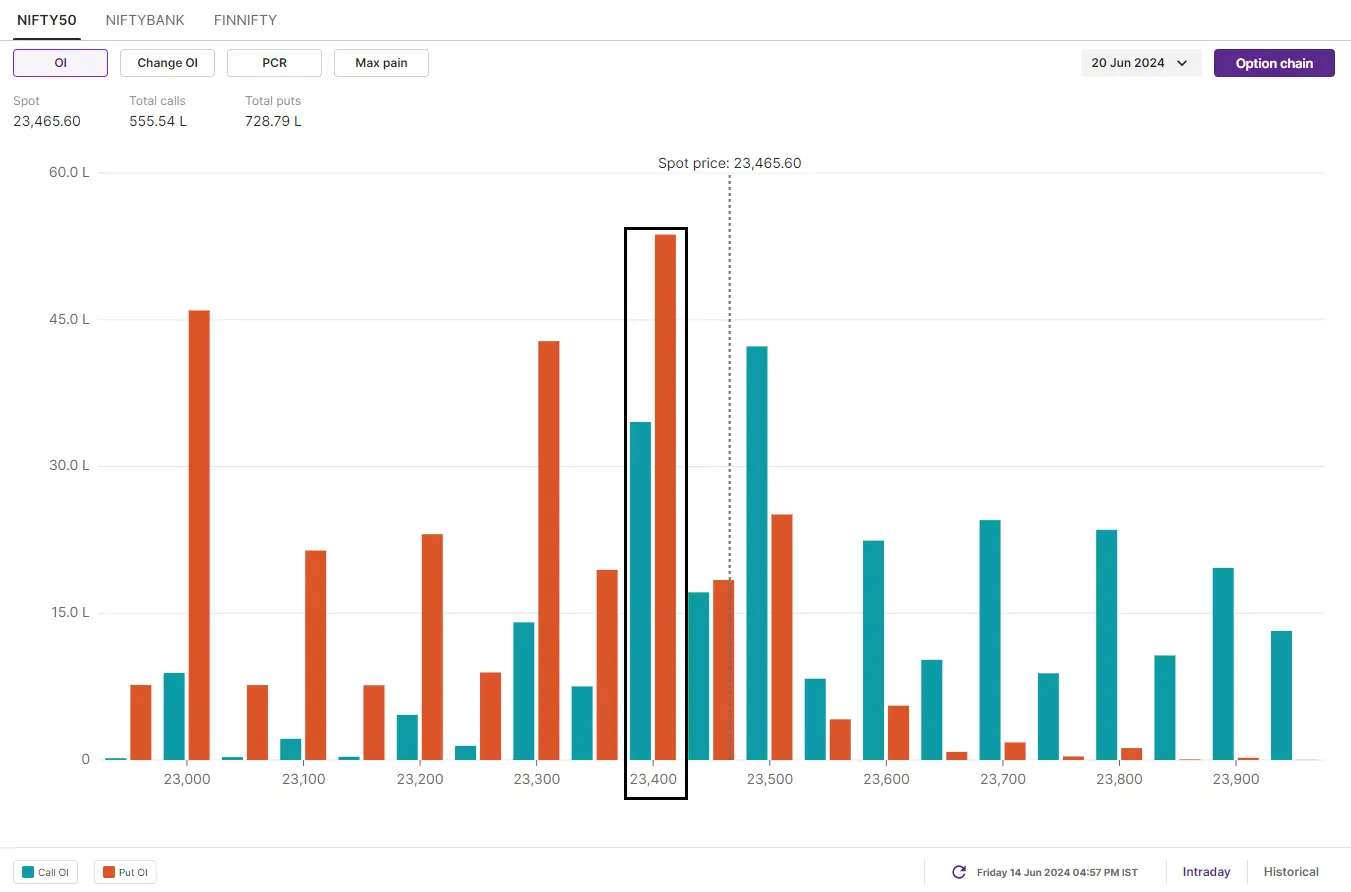
The open interest (OI) positioning for the 20 June expiry of NIFTY50 has maximum call OI at 24,000. The put OI on the other hand is accumulated from 23,400 to 23,000 strikes. This indicates that traders are expecting NIFTY50 to trade between 22,800 and 24,100 in the upcoming week.
The technical structure on the chart of NIFTY50 shows a slightly different picture from our breadth indicator. Our breadth indicator, which highlights NIFTY50 stocks trading above their 50-DMA, has recorded a reading of 90%, placing it slightly in the overbought zone. However, the weekly chart of NIFTY50 recouped the entire previous week’s losses and closed above its high, resulting in a rally of 10% from the previous week’s low.
Since the index has closed at an all-time high, the immediate resistance remains the psychological level of 24,000, as it has the maximum call OI. On the flip side, multiple supports are available in the 23,200 and 22,800 zones. In the coming week, the index may consolidate its gains and could witness a minor pullback, but in all such cases, the broader trend is likely to remain positive until the index closes below 22,800 on the daily chart.
F&O - BANK NIFTY outlook
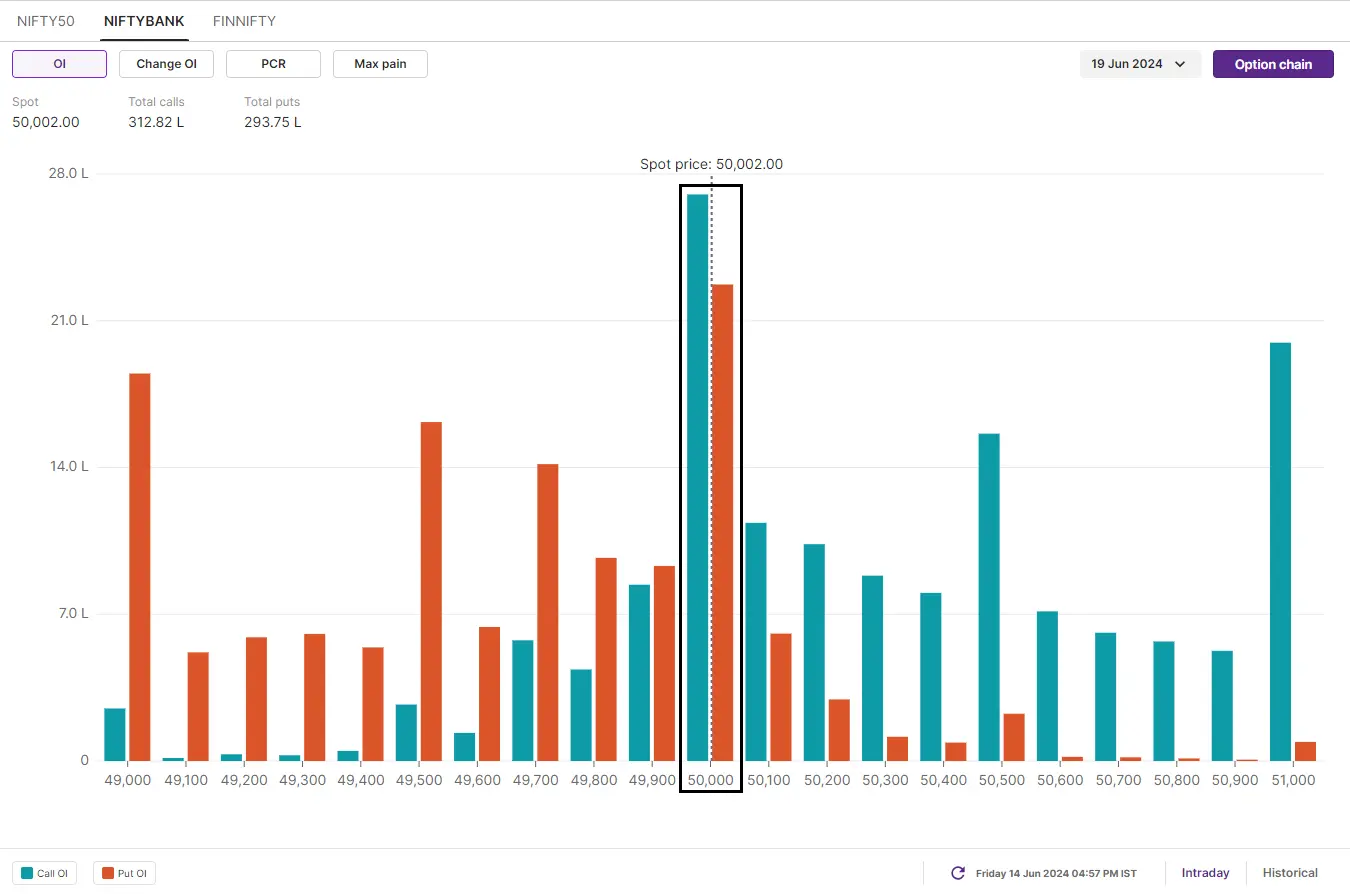
For the 19 June expiry, BANK NIFTY data shows the maximum call and put open interest at 50,000 strike, suggesting rangebound activity in the coming sessions. Based on OI positioning, traders expect the BANK NIFTY to trade between 49,000 and 51,000. However, as the index has been consolidating in a narrow range for the past five trading sessions, the technical structure on the chart may provide better clues.
The weekly chart of the BANK NIFTY highlights a wait-and-watch approach. The index has formed a neutral candlestick pattern, known as a doji, which signifies indecision among traders. For the coming week, traders should watch the high and low of the doji candle. A break of either the high or low on a closing basis will indicate the upcoming trend of the index. On the flip side, until the index breaks the highlighted range, traders can plan for range-bound strategies.
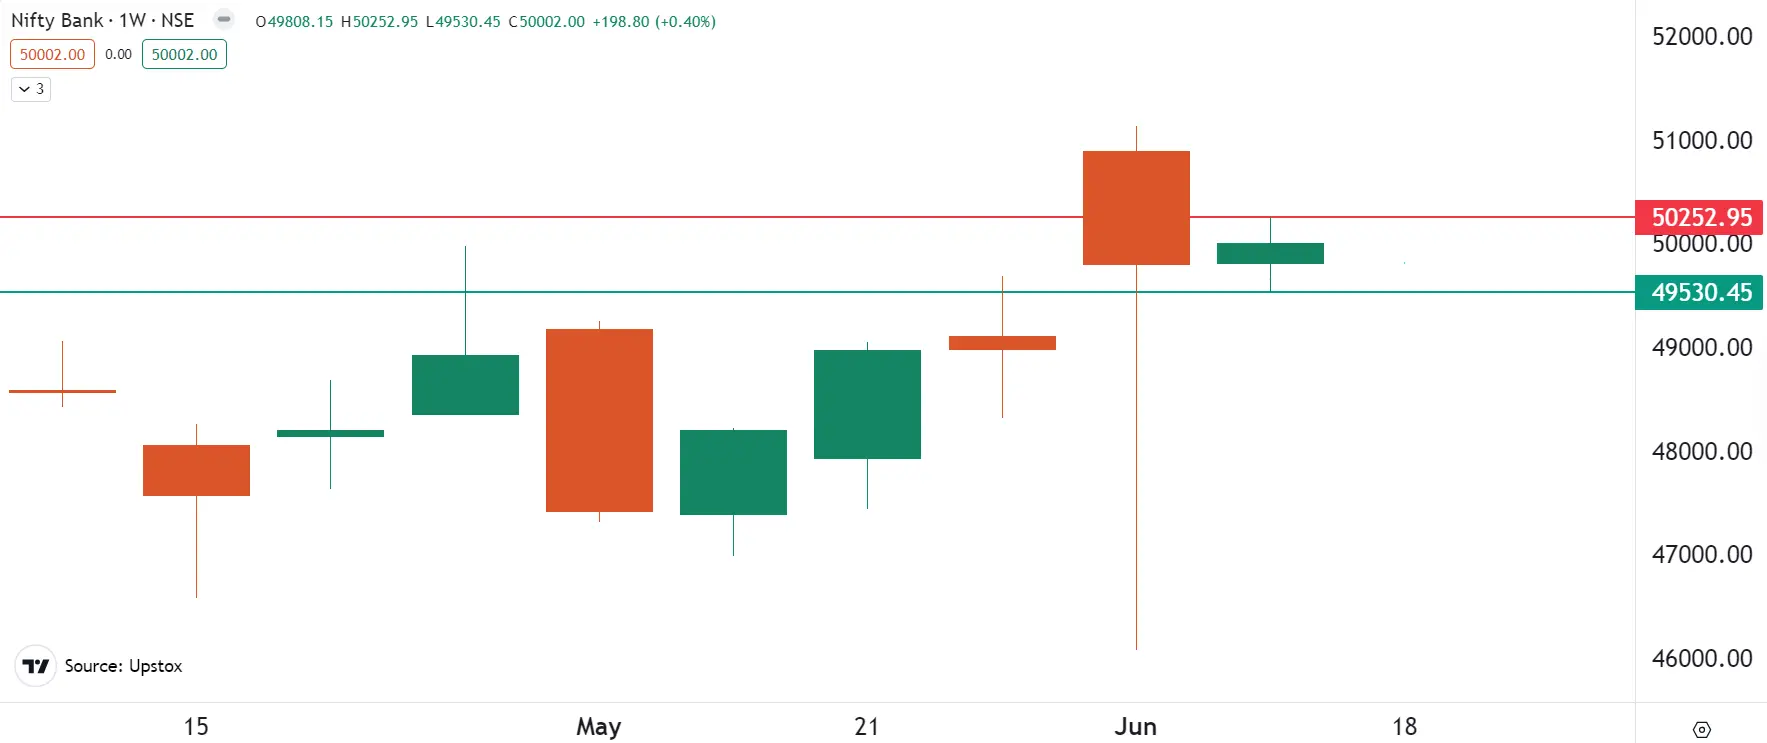
Looking ahead, the index may remain sideways until the Union Budget is announced in the first week of July. Meanwhile, sharp bouts of intraday volatility may trigger minor pullbacks, but the index is expected to stay sideways to bullish as long as it does not close below 22,800 on the daily timeframe.
And to stay ahead of all the intraday developments and trading levels, stay tuned to our daily morning trade setup blog, available before the market opens at 8am.
About The Author
Next Story


