Market News
IT stocks bounce back: NIFTY IT jumps 10% in four sessions; HCL Tech and Tech Mahindra cross 200 EMA

4 min read | Updated on October 14, 2026, 14:00 IST


SUMMARY
The rebound in IT stocks near 52-week low levels after falling over 30% from the record highs brings it under the spotlight amid the lacklustre atmosphere in the broader market. Here is how the key IT stocks are placed on technical charts after the latest pullback

IT stocks gain the most this week, surging as much as 5.5%. Image: Shutterstock.
The IT stocks are buzzing again on Wednesday after posting a resurgence on Tuesday. The sectoral benchmark for IT stocks, NIFTY IT index surged over 5.5% this week till date as investors turned optimistic on IT stocks after taking cues from the quarterly earnings report for the Q2FY27. The benchmark NIFTY IT surged over 5.2% on Tuesday posting one of the best performance in more than a year. The rebound was largely driven by strong rallies in the index heavyweights like TCS (+6%), HCL Technologies (+8%), Infosys (+4%) and Tech Mahindra (+4%).
The rebound in IT stocks near 52-week low levels after falling over 30% from the record highs brings it under the spotlight amid the lacklustre atmosphere in the broader market. Here is how the key IT stocks are placed on technical charts after the latest pullback
TCS
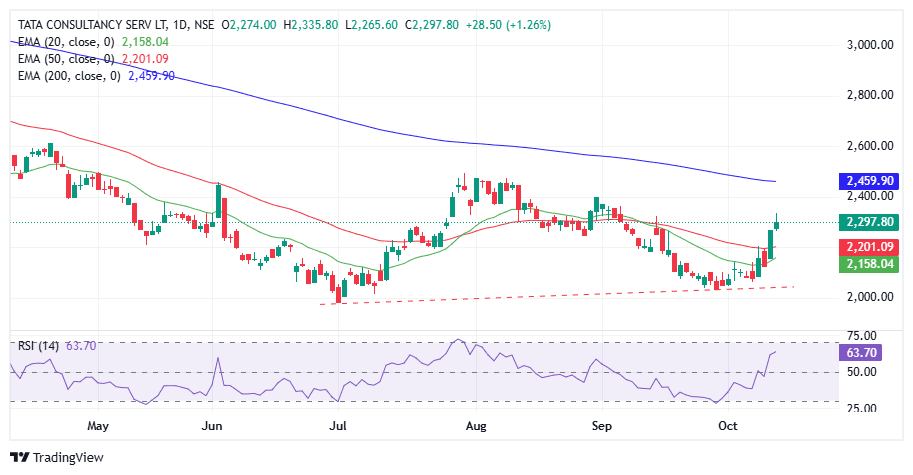
Tata Consultancy Services shares have bounced back more than 15% in ten trading session, aiding strong rally in the benchmark NIFTY IT index. On the daily charts, the stock is trading above its 20 and 50 EMA and indicating towards a positive crossover. However, the long term structure continues to remain sideways until it crosses its 200 EMA mark of ₹2,459 apiece.
Infosys
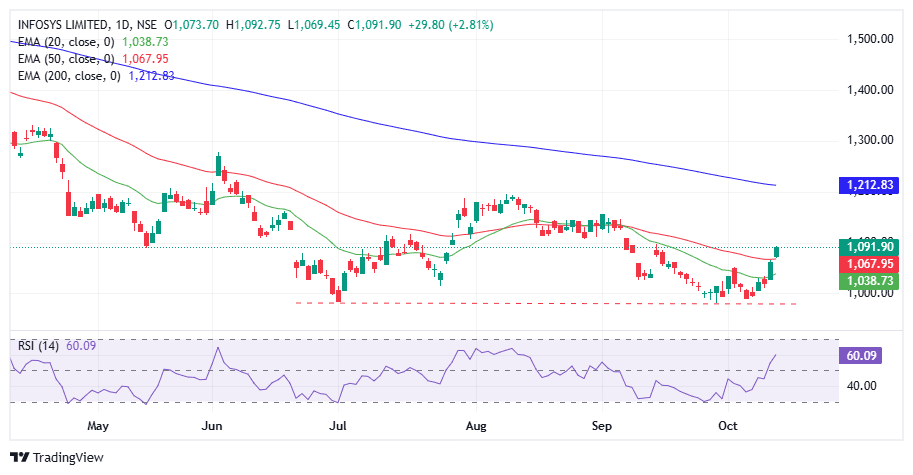
Infosys share price jumped over 10% in the 10 trading sessions, posting a double bottom candlestick pattern near ₹979 level. Similarly, in the recent pullback rally, the shares have crossed their 20 and 50 EMA and show signs potential positive crossover. The RSI of 58 indicates a strong bullish strength after a strong bounce back from lower levels. Meanwhile, the 200 EMA level of ₹1208 remains the crucial resistance.
HCL Technologies
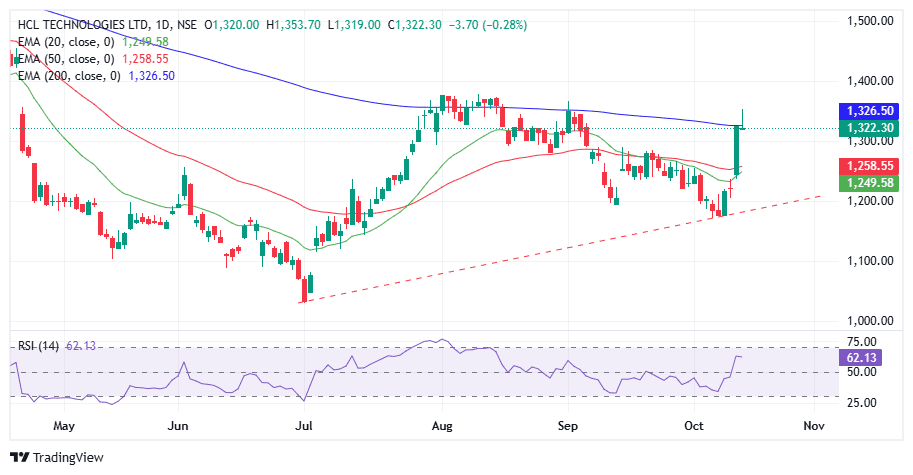
HCL Technolgies shares have shown relative outperformance over its closest peers like TCS, Wipro, Infosys and Tech Mahindra, sustaining the gains of the rally from July lows. Additionally, the stock has also crossed its long-term moving average of 200 EMA on Wednesday, implying reversal in momentum from bearish to bullish on the long term charts.
Tech Mahindra
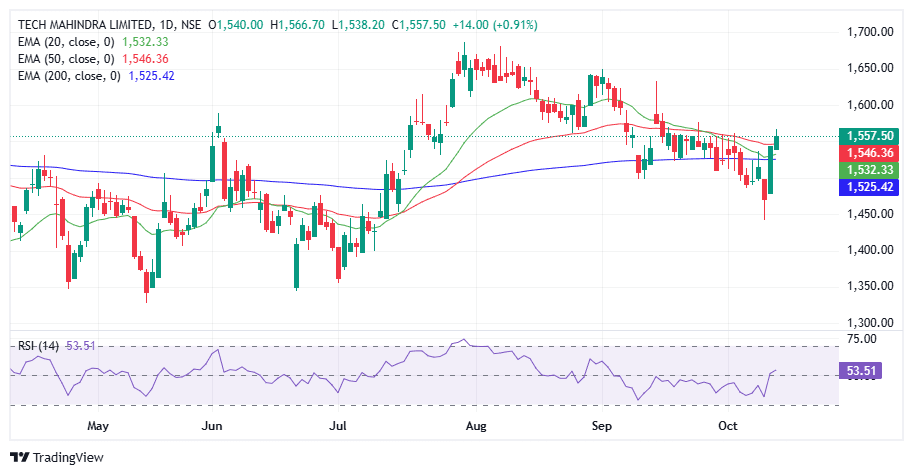
Shares of Tech Mahindra, one of India’s leading IT companies, have bounced over 9% in three trading sessions, posting sector leading rally. The bounce back took the shares over short term and long term averages of 20, 50 and 200 EMA levels of₹1,531, ₹1,546 and ₹1,526 respectively. Furthermore, the chart also signals a positive crossover of 20 EMA crossing 50 EMA from below, indicating sustained bullish momentum in the stock.
Wipro
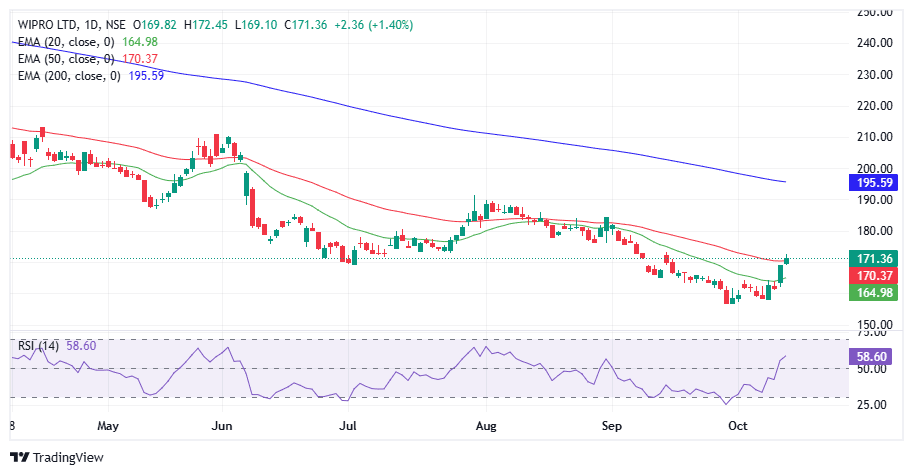
Wipro shares are particularly in focus after they got excluded from the NIFTY IT index. However, the shares have managed to rally in the current pullback in the IT stocks. The shares have surged over 7% and trade above short-term moving averages of 20 and 50 EMA, showing signs of revival in momentum. Meanwhile the 200 EMA level of ₹195 apiece remains a crucial resistance.
NIFTY IT
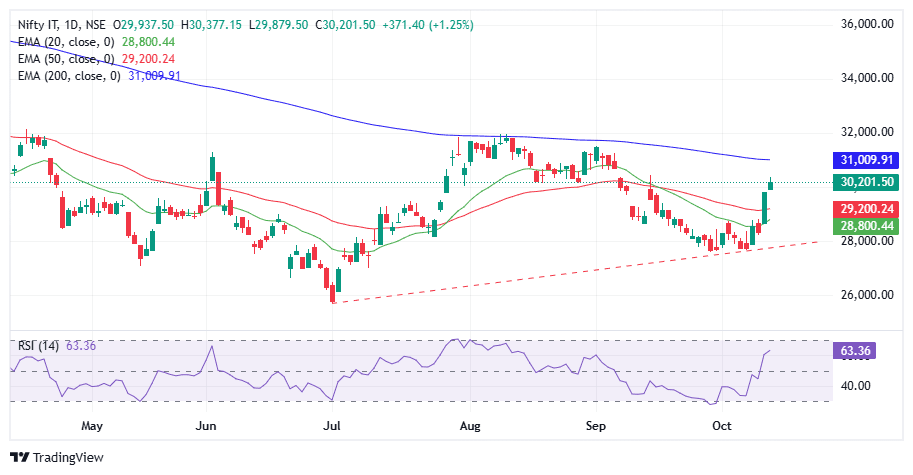
Collectively, the NIFTY IT index is also showing signs of bottoming out after the recent rally. In the long-term the momentum could further strengthen in the NIFTY IT index if it crosses above the 200 EMA level of 31,024 levels.The index briefly trades below the long-term moving averages since February 2026 and failed to cross it in the previous two attempts in August and September. On the downside, the upward sloping trendline support remains at 28,800 and 31,000 as crucial resistance, a breakout or breakdown from this range will help decide the direction for the IT index.
Related News
About The Author
Next Story