Market News
Chart check: Here’s how major indices are placed after a sharp recovery from lower levels

4 min read | Updated on March 21, 2025, 15:40 IST


SUMMARY
Sharp recovery from the lower levels has shown signs of strength and change in the investor sentiment from bearish to slightly bullish. Majority of the stocks in the key indices like NIFTY50, SENSEX, NIFTY Midcap 150 and Smallcap 250 now trade above short-term moving averages.

GIFT NIFTY traded 47 points higher indicating a positive start for Indian markets on Friday.| Image source: Shutterstock.
Indian investors are riding the bullish momentum in the markets, as the NIFTY50 and SENSEX climbed nearly 5.5% from the lows hit on March 4. The NIFTY50 has gained more than 1,000 points from the lows, and the SENSEX has rallied nearly 3,500 points from the lows of March 4. Similarly, the broader markets have outperformed the benchmark indices by a wide margin, jumping 7.5-8% during the same period. The rally was broad-based most of the stocks advanced more than 10%.
Looking at sectoral indices, the Metals, Power, Defence, Hospitality, and Hospitals are up more than 10% for the month in this recovery rally. However, large, midcap and small-cap IT companies were the key laggards in this rally, declining nearly 10% this month. They were followed by agri and construction and materials services, electricals and wires, which are down more than 6% in the same period.
NIFTY50
 (Source: Upstox.pro, Tradingview)
The 50-share benchmark index has recouped 1,400 points from lower levels and has reclaimed 200 DEMA level of 23,397 on Friday. The rally started on March 5, but stagnated on March 17 as the index struggled to cross its 20 SMA level.
The index crossed 20 SMA level on March 18 and jumped nearly 900 points in four sessions. The 20 SMA level indicates a short-term average which helps gauge short-term trends in the markets, while 200 SMA indicates a long-term trend.
The recovery from the lower level was broad-based as most of the NIFTY50 stocks contributed to the rally. In all, 34 of the NIFTY50 stocks have crossed 20 SMA levels indicating a strength in the recovery rally. On a longer-term basis, 12 stocks have crossed their 200 DEMA levels showing signs of extensions of the current rally.
SENSEX
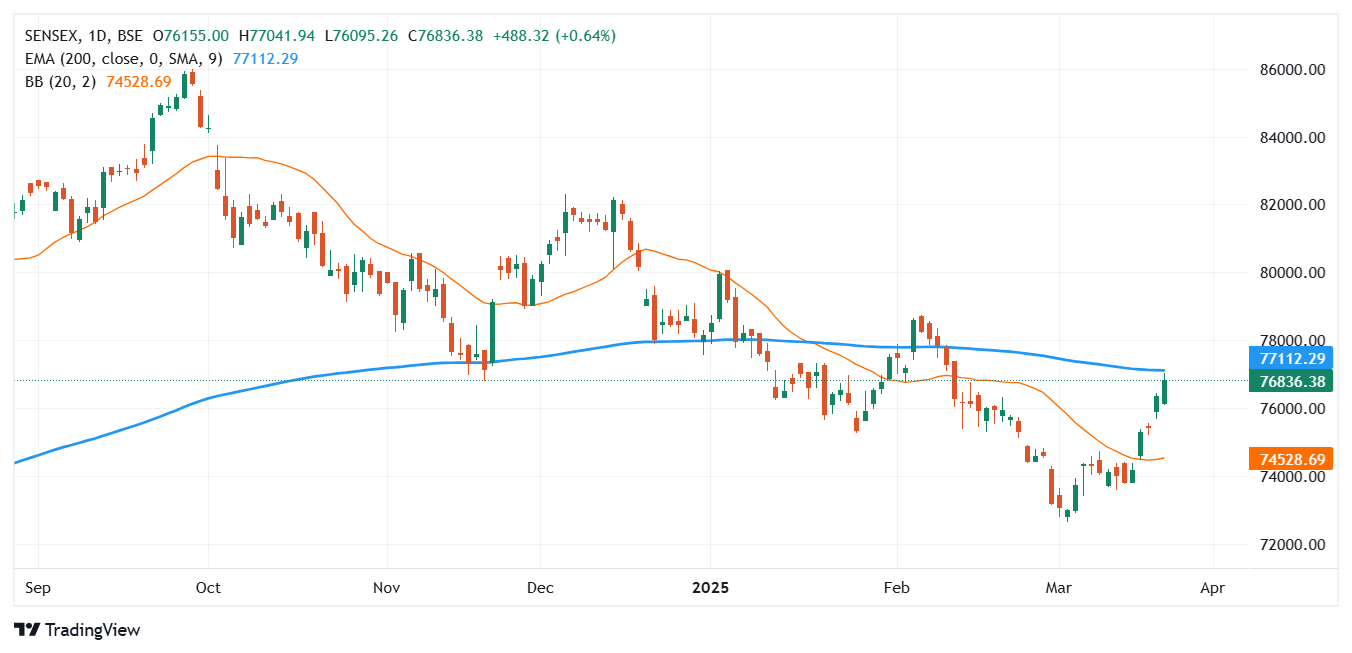 (Source: Upstox.pro, Tradingview)
The 30-share SENSEX index has jumped more than 4,300 points or 6% from the lower levels. Similar to NIFTY50, SENSEX too touched 200 EMA levels of 77,137 on Friday. The recovery from lower levels was led by metals, financials and consumption-related stocks. 19 out of the 30 stocks from the index now trade above 20 SMA levels and 7 stocks have crossed their 200 DEMA levels indicating broader participation in the rally.
NIFTY Midcap 150
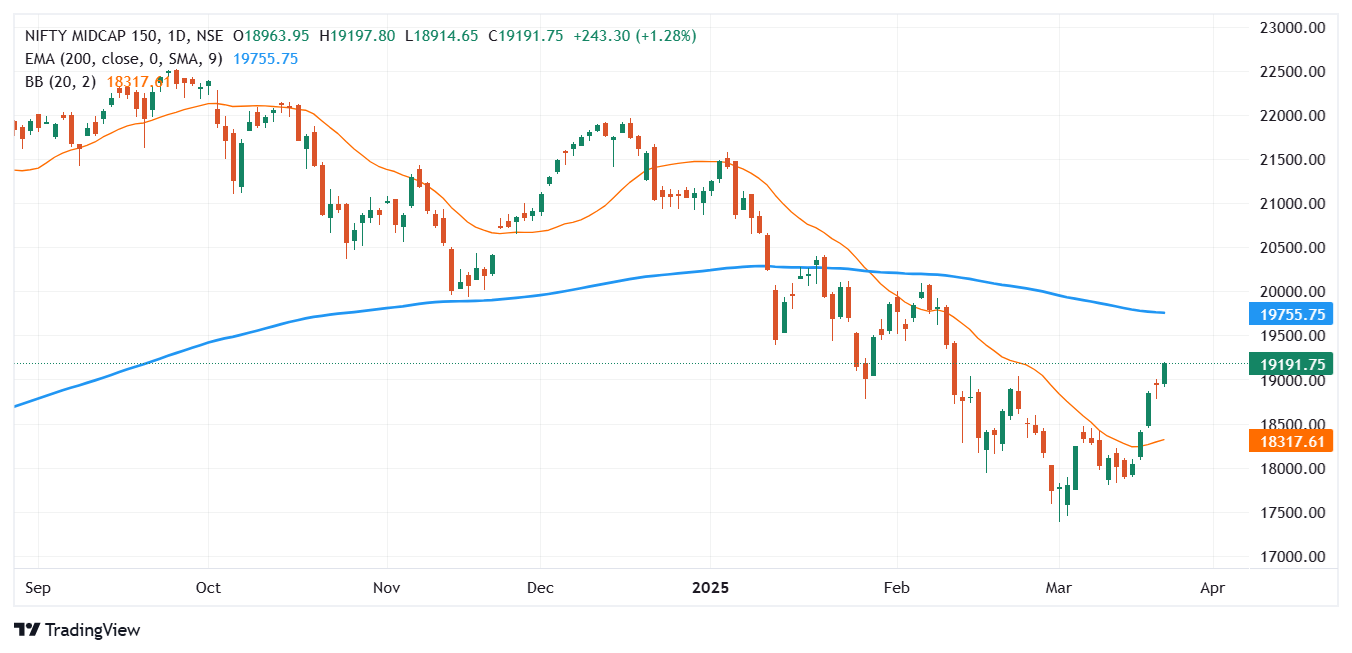 (Source: Upstox.pro, Tradingview)
The Midcap 150 index which covers the top 150 midcap stocks in the NSE has shown more than 10% or 4,800 points of recovery from the lower levels. The index has fallen nearly 23% from the record-high levels to hit the 52-week low of 17,379 levels. The index breadth has improved substantially from the lower levels as 114 stocks now trade above 20 SMA levels indicating broader strength in the market. Similarly, 26 stocks have crossed 200 SMA levels indicating a sustained momentum for the longer term period.
NIFTY Smallcap 250
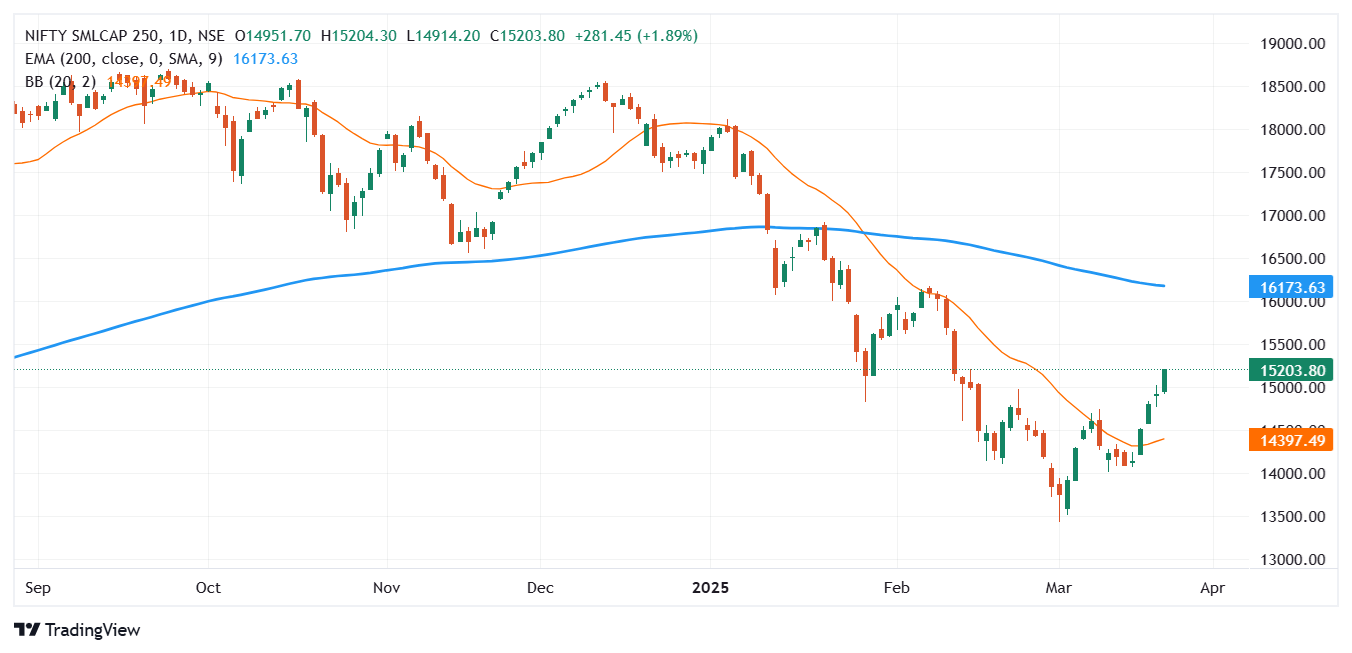 (Source: Upstox.pro, Tradingview)
The smallcap index, which was the most beaten down among all major broader indices, has shown a sharp recovery from lower levels. After falling for more than 27% from the record-high levels, the index has shown a sharp recovery of 12% from lower levels. After the sharp recovery, 70% of the stocks now trade above 20 SMA and 13% above 200 SMA levels. Despite the sharp recovery, 116 stocks still traded in the low zone 13 in the high zone, remaining 122 stocks traded in the mid zone. This indicates that most the stocks have room for recovery after falling up to 50% from the record-high levels.
In summary, the recovery from the lower levels was contributed at granular levels as the majority of the stocks have now crossed their short-term average of 20 SMA levels, indicating a change in stance from bearish to slightly bullish. However, the longer-term rally above 200 SMA levels may require more heavy lifting in the months ahead for the markets to reclaim their all-time high levels.
About The Author
Next Story


