Market News
NIFTY50, SENSEX remain sluggish despite GST bonanza; here's what the charts suggest

3 min read | Updated on September 05, 2025, 13:52 IST


SUMMARY
As markets digested all the negative news arising from weak Q1 earnings, Trump tariffs, investors were optimistic about markets reacting positively to GDP numbers, GST rationalisation developments. However, markets are in no mood to bounce back. Chart analysis of key benchmarks and broader indices indicates increased caution.

NIFTY50, SENSEX trade in flat range on a yearly basis, underperforming its global counterparts. Image source: Shutterstock.
Indian investors are puzzled by the current market behaviour, with the Indian market’s sluggishness despite multiple positive cues. This volatility, which is range-bound, has kept even traders at bay. Indian markets are the only underperforming markets amongst the global major economies. On a one-year basis, Indian markets are trading almost flat with no positive returns. Meanwhile, Japan, the US, China, Germany, and the other economies in the top five categories are boasting high double-digit returns.
With the majority of the positive cues now behind us, what could lead the markets in the near future? Here is what long-term charts indicate for the key indices.
NIFTY50
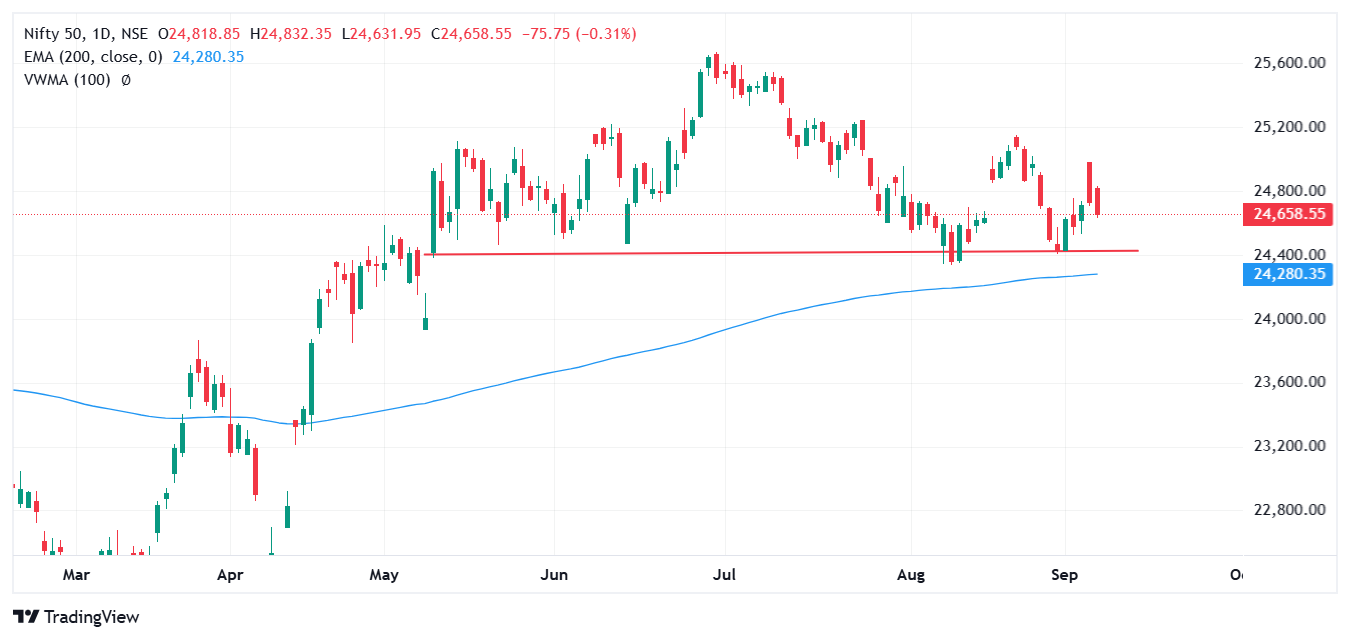
NIFTY50 is holding on to the crucial support zone of 24,400 to 24,500 on the daily charts. The index has reversed from these levels for three instances since May 2025. The overall chart structure also indicates increased pessimism at higher levels as the index is forming a lower high candlestick pattern. On the downside, investors and traders eye the support of the 200 EMA of 24,280 in the worst-case scenario, amid continued selling pressure.
SENSEX
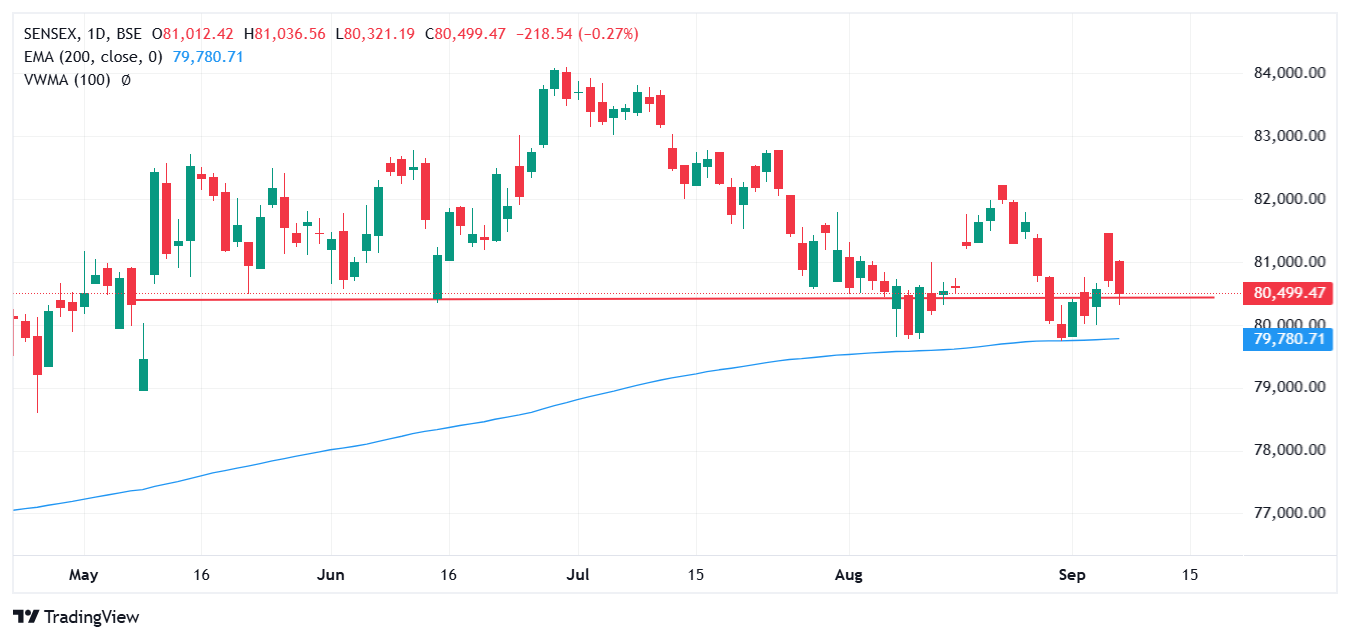 Similar to NIFTY50, SENSEX also formed a lower high candlestick pattern, indicating increased bearishness. In addition, the index now eyes for the support of 200 EMA level of 79780, which is also the near term swing low levels. Experts believe, the index could face more selling pressure and pessimism below these levels.
NIFTY Midcap 100
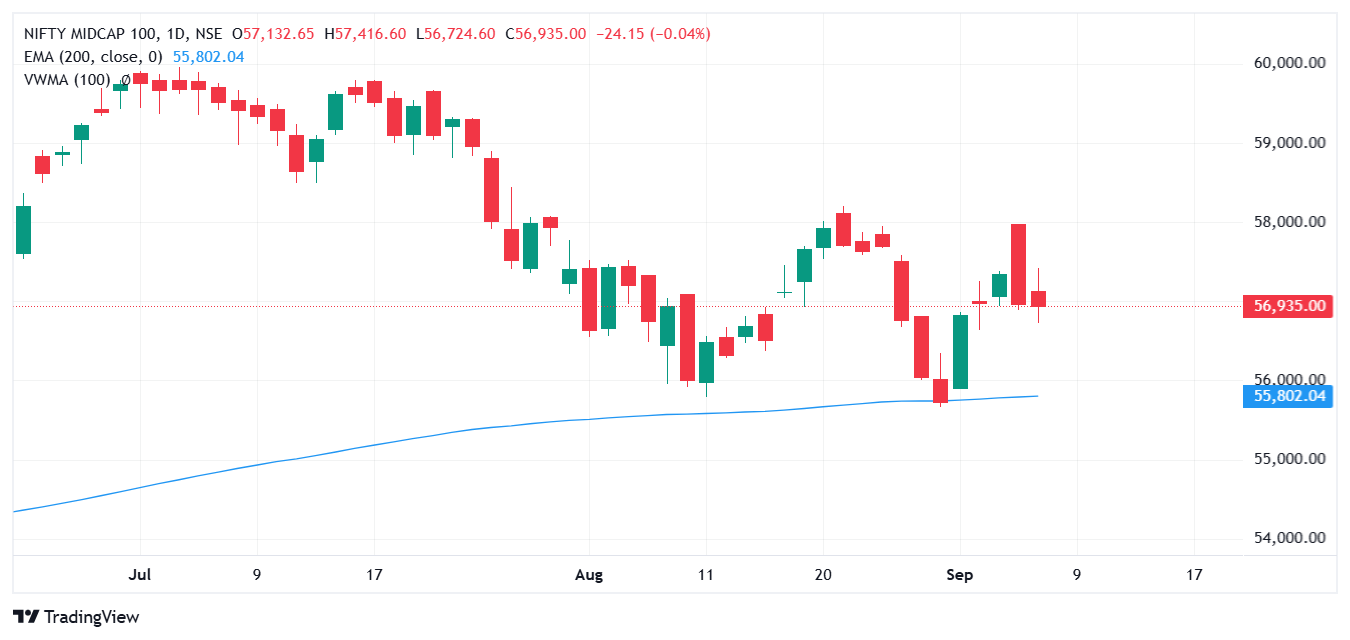 The broader market index posted an bearish engulfing candlestick pattern on Thursday, indicating sharp reversal to the bearish setup. The index has delivered -4.6% returns in the year, underperforming the benchmark indices as well. The medium to long term average of 200 EMA stands at 55,081, which considered to be the nearest support in the current bearish setup for the index.
NIFTY smallcap 100
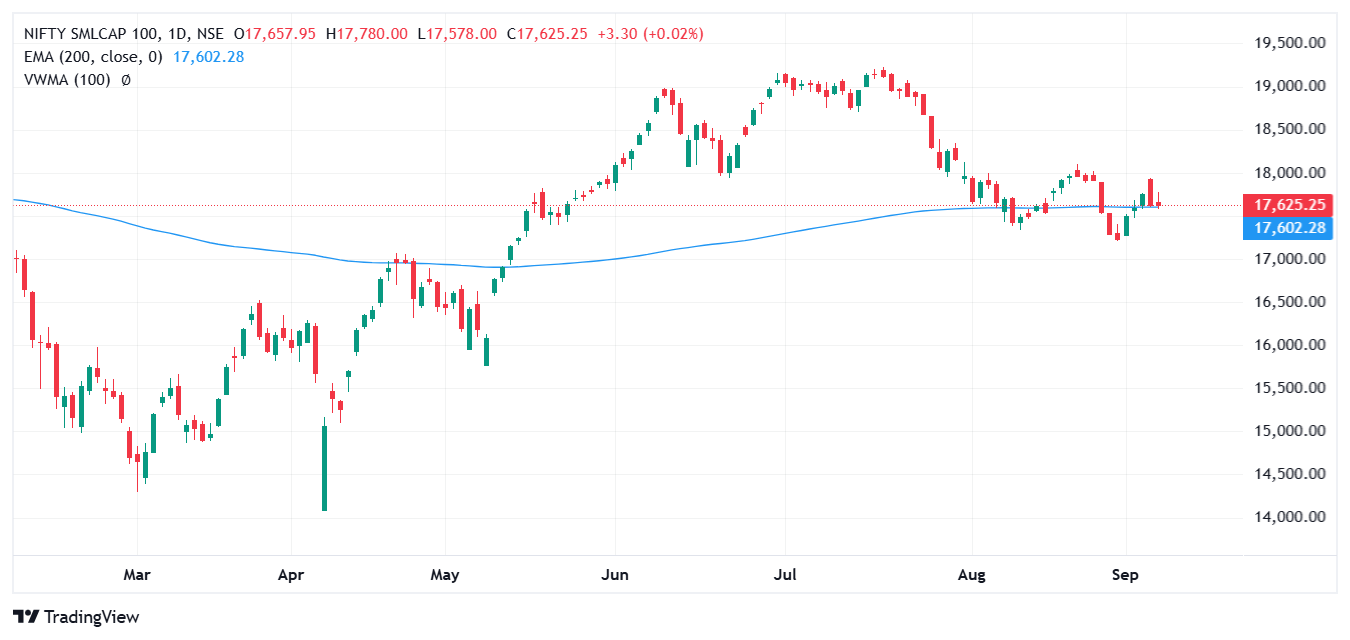 The smallcap index’s chart shows more pain volatility compared to the the other broader and benchmark indices. The index has hovered around the 200 EMA of 17,602 and shows neutral outlook with more consolidation ahead. The index has shown more pain than others by falling over 8% in the last one year.
India VIX
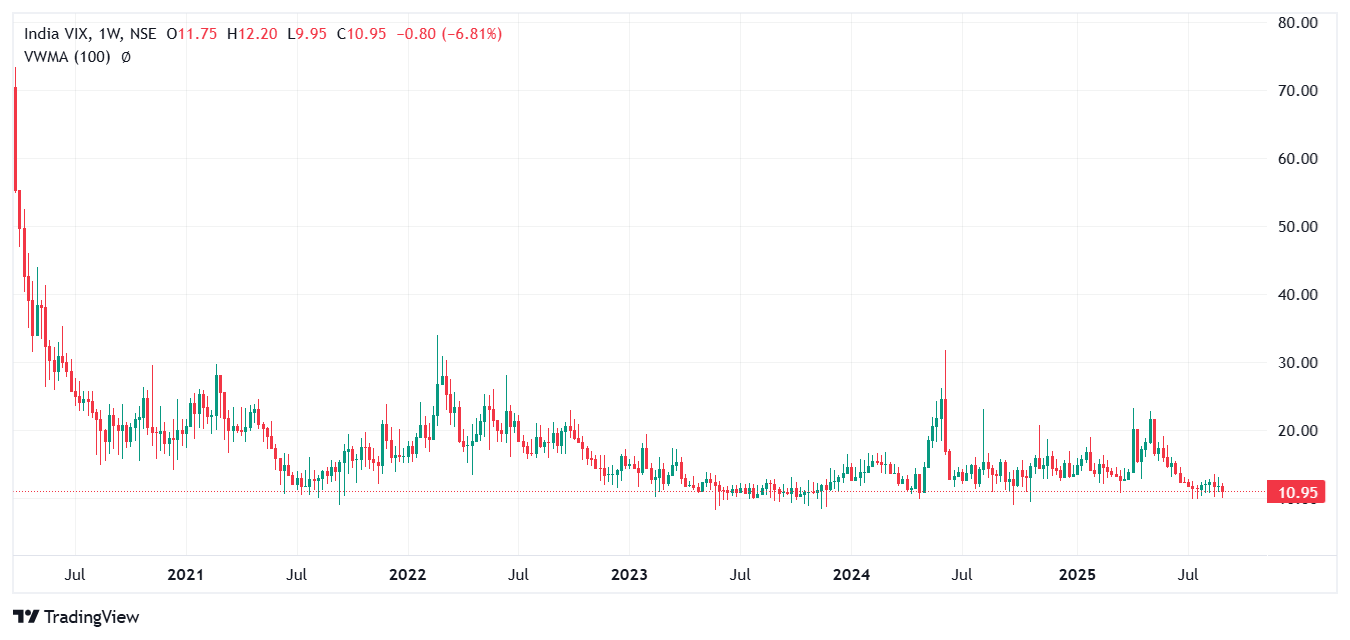 The volatility index continues to remain in the multi-year low range of 10 to 11. This indicates absence of major upside or downside in the Indian markets. As we have seen in the recent past, despite the key positive triggers like strong GDP growth, GST rate rationalisation, RBI rate cut, Income tax boost have failed to excite investors which in the bullish market leads to high market activity.
About The Author
Next Story


