Market News
Amid sell-off in Indian markets, know the key support levels for benchmark indices
.png)
4 min read | Updated on June 04, 2024, 14:37 IST


SUMMARY
Considering, the index has slipped below the key short and intermediate moving averages, the question is where is the next support? Support is seen around the important long-term moving average i.e. 200-DMA.
Sharp sell-off in Indian equity markets, know where the support stands for key benchmark indexes
This statement is so apt for the current market situation, it was just a day back i.e. on Monday, Indian equity markets were jubilant and the only route it was taking was on the upside and hitting record highs. The NSE Nifty, BSE Sensex and Bank Nifty, all these indices hit record highs on Monday amid exit polls indicating the BJP-led NDA coming into power for the third term. But, with voting in progress, it seems it's going to be a nail-biter outcome of the General election of 2024.
Considering this, there is a sense of uncertainty among the market participants, and the majority of the indexes recorded their sharpest single-day fall on Tuesday. We will understand where the next support for the key indexes is.
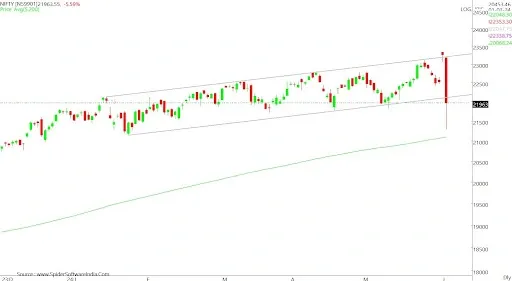
On Monday, the NSE benchmark Nifty50 index closed at a record high with a gap-up. A gap-up is formed when the opening price is significantly higher than the previous trading day’s closing price, leaving a gap on the price chart. Though it closed at a record high and with a gap-up, the formation of Hanging Man on the daily chart of the Nifty50 index was not a pleasing sign from a technical perspective.
All eyes were set on the election result day. Moreover from a technical perspective whether we get a confirmation of the hanging man pattern or not. A hanging man candlestick pattern has a long lower shadow and a small body, this pattern acts as a warning sign, telling market participants to brace for a possible change in the market direction.
On Tuesday, the pattern was confirmed as the index opened with a gap-down. Furthermore, it formed an open=high candle which indicates bears dominated right from the start of the trading session and hence, the opening price turned out to be the highest price of the day.
Technically, on Tuesday, the Nifty50 index slipped below its crucial short-term moving average i.e. 20-DMA (Day Moving Average). Subsequently, it has moved below its 50 and 100- DMA as well. The 50 and 100 DMA serves as an intermediate-term and medium-term indicator.
Bank Nifty
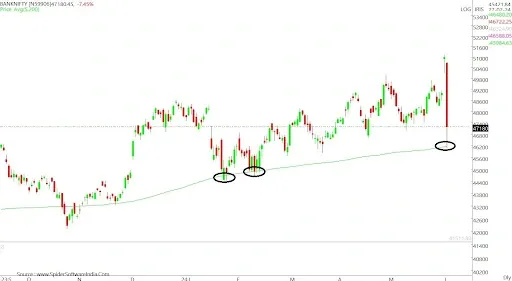
The fact that the index bounced off the 200-DMA highlights its significance for long-term market participants. The 200-DMA is widely followed and often considered a critical level. When an index holds above this moving average, it indicates strength and resilience.
The Bank Nifty index taking support around the 200-DMA highlights the significance of the 200-DMA as this is a widely followed moving average for the long-term market participants as well.
BSE Sensex
The BSE Sensex is also trading below its short and intermediate support levels as defined by the 20 and 50-DMA. However, the index is trading above its 200-DMA and the 200-DMA is placed at the level of 70,022 level, so this would be an important support level for the index.
Nifty Midcap 100
The Nifty Midcap 100 index is trading below its 20 and 50-DMA. On an intraday basis, the Nifty Midcap 100 slipped below the 100-DMA, but it has bounced back from the lower levels and is trading above the 100-DMA. It is not the first time the Nifty Midcap has found support around the 100-DMA. Back in March, the index took support at its 100-DMA and the same is highlighted in the chart.
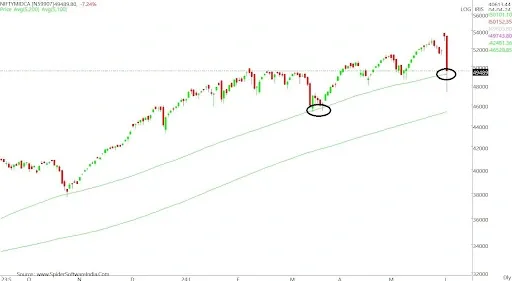
Tuesday's session low of 47,246.60 is likely to act as crucial support followed by the long-term moving average of 200-DMA which is placed at the level of 45,310.
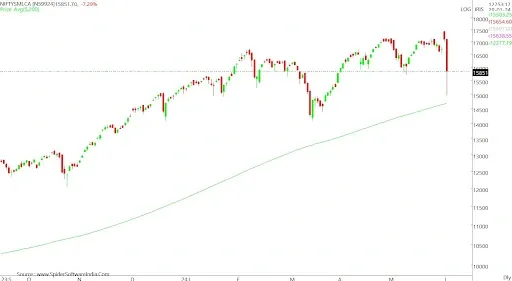
Nifty Smallcap 100
The Nifty Midcap 100 index is trading below its 20, 50 and 100-DMA. The 200-DMA for the Smallcap 100 index is placed at the level of 14,688 and this should be considered as an important support for the Smallcap 100 index.
About The Author
Next Story


