Market News
Infosys Q1 results: Check earnings preview and how to trade in Infosys ahead of its first quarter results?
.png)
4 min read | Updated on July 23, 2025, 08:54 IST
SUMMARY
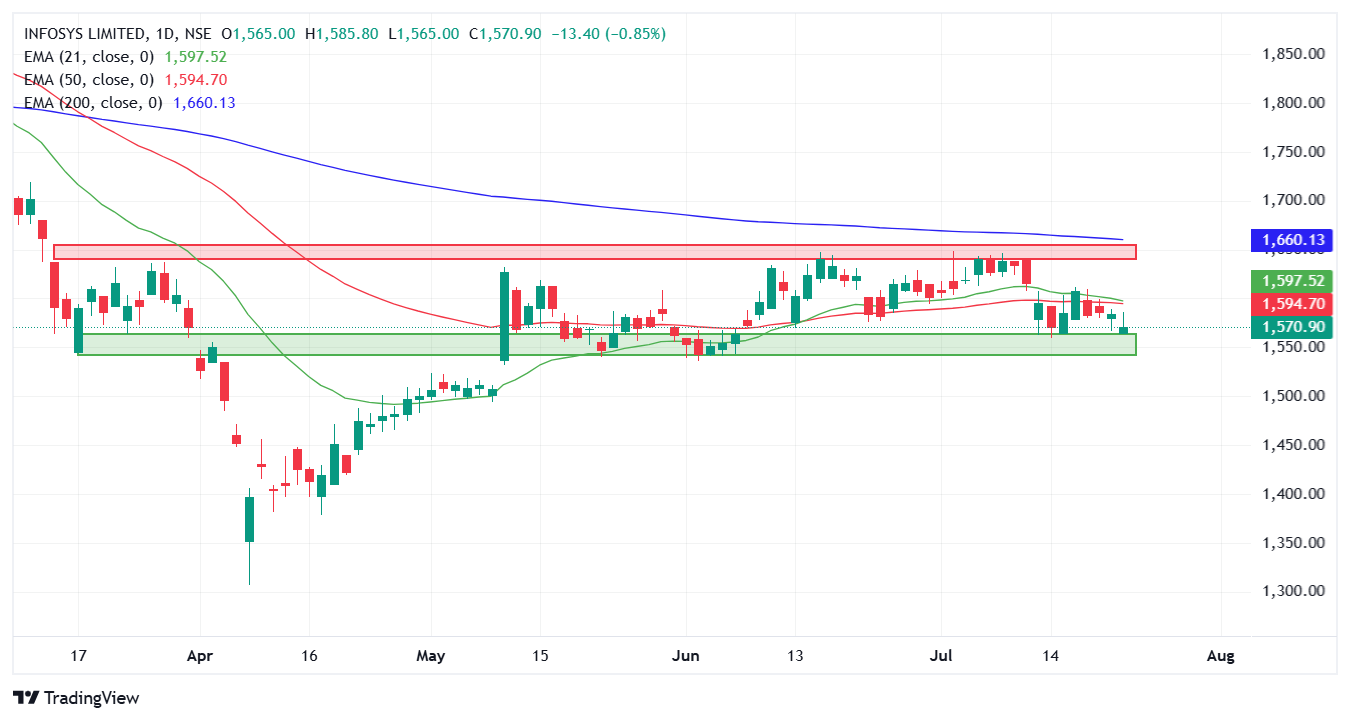
Following the earnings announcement, Infosys investors will be closely monitoring the FY26 revenue guidance and new deal wins for further direction. Technically, the stock has been confined within the ₹1,530–₹1,650 range over the past two months and has recently formed an inverted hammer candlestick pattern.
Stock list

Infosys shares closed 0.5% lower on Tuesday. Image source: Shutterstock.
IT giant Infosys is set to announce its earnings for the June quarter on Wednesday, 23 July. According to experts, Infosys could report flat revenue growth on a sequential basis, while net profit may decline slightly.
The company's net profit is expected to range from ₹6,670 to ₹7,730 crore, which is a decline of 4–5% compared to the previous quarter. The company reported net profits of ₹7,033 crore in Q4 FY25 and ₹6,368 crore in the same quarter last year.
According to experts, Infosys' Q1 revenue could increase by 2–5% sequentially to ₹41,850–42,350 crore. The company registered revenues of ₹40,925 crore in Q4 FY25 and ₹39,315 crore in the June quarter of FY25.
Compared to other tier-1 IT companies, Infosys is likely to report decent quarterly earnings, aided by upbeat growth in the financial services segment, seasonal recovery, and new acquisitions. The company’s EBIT margins are expected to remain stable at around 20.9%, supported by favourable currency movements.
Investors will be closely tracking any changes to Infosys' FY26 revenue guidance. Experts believe that the IT giant may raise the lower end of its full-year guidance from the previous 0–3% range amid improving market sentiment. New deals won during the June quarter and the management's commentary on IT discretionary spending will also be closely watched.
Ahead of the Q1 results announcement on Wednesday, 23 July, Infosys shares ended the previous day’s session 0.8% lower at ₹1,570. So far this year, Infosys shares have fallen 16.3%, in line with other IT stocks, due to uncertainty surrounding U.S. trade tariffs, which could lead to an economic slowdown.
Technical view
The technical structure of the index remains rangebound between ₹1,650 and ₹1,530 over the last two months. Additionally, the stock is trading below all its key daily exponential moving averages like 21, 50 and 200, indicating that the broader trend remains sideways to bearish.
However, it has formed an inverted hammer candlestick pattern at a crucial support zone of ₹1,530. It is a pattern with a small real body near the low and a long upper wick. It appears after a downtrend and suggests a potential bullish reversal if the subsequent candle closes above the reversal pattern's high. Conversely, a close below the low of the reversal pattern signals weakness.

Options outlook

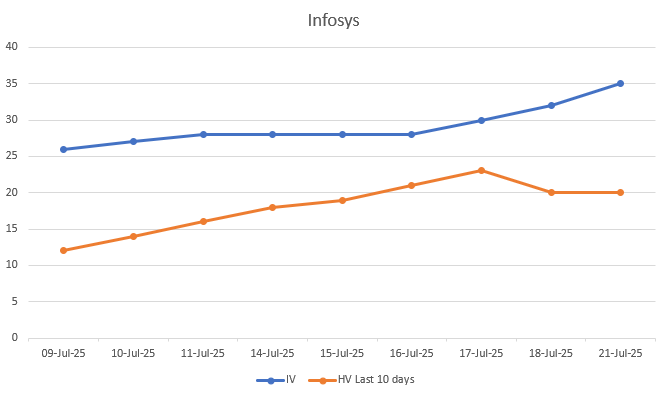
Additionally, the implied volatility (IV) for Infosys has steadily increased and has reached 39, sharply outpacing the 10-day historical volatility (HV), which has remained relatively flat after a brief spike.
Let’s examine how Infosys stock has reacted to its quarterly earnings announcements over the past two years to gain insights into its price movements.

Options strategy for Infosys
With the options market pricing in a ±4.9% move ahead of 31 July expiry, traders can look at Long or Short Straddle strategies to trade the expected fall or rise in volatility.
A Long Straddle involves buying both a call and a put at the at-the-money (ATM) strike with the same expiry. It’s a volatility play—profitable only if Infosys moves more than ±4.9% in either direction.
However, if you expect the stock to stay within the range of ±4.9%, a Short Straddle might make sense. This involves selling both the ATM call and put. It works best when the stock stays flat and volatility drops, allowing the trader to keep the premium received.
Traders with a directional view - bullish or bearish - can consider using spread strategies instead of simply buying options. A Bull Call Spread or Bear Put Spread offers a more defined risk/reward setup and is a more efficient way to trade directional moves.
Disclaimer Derivatives trading must be done only by traders who fully understand the risks associated with them and strictly apply risk mechanisms like stop-losses. The information is only for educational purposes. We do not recommend any particular stock, securities and strategies for trading. The stock names mentioned in this article are purely for showing how to do analysis. Take your own decision before investing.
About The Author
Next Story

