Market News
How does the earnings season impact your portfolio? All you need to know
.png)
8 min read | Updated on April 23, 2024, 17:27 IST


SUMMARY
On any given day, there may be little market news about a particular company. Perhaps a company is updating and re-releasing a customer-favorite product or maybe a company is seeing bad press because consumers are having problems with a company’s latest product. These “sound bites” may move a stock’s price but investors and traders won’t know for certain how this news will truly impact a company’s financials. That is why the earnings announcement is so important.
Stock list

Out of the total brokerage stocks covered in market wrap, six concluded the session in positive territory.
What happens with earnings announcements?
So, what happens with earnings announcements and how could it impact your portfolio? On any given day, there may be little market news about a particular company. Perhaps a company is updating and re-releasing a customer-favorite product or maybe a company is seeing bad press because consumers are having problems with a company’s latest product. These “sound bites” may move a stock’s price but investors and traders won’t know for certain how this news will truly impact a company’s financials. That is why the earnings announcement is so important – market participants learn if the past news about a company was substantive enough to move sales up or down.
Accompanying the earnings announcement, which includes detailed financial statements with key metrics like revenue, costs, and cash balances, is a conference call with management. During this conference call, key company leaders discuss the financials, any headwinds or tailwinds that the company is facing, as well as plans for the future. All of this information tends to make stock and option prices more volatile than on any other day of the year.
How does the market react to earnings?
With the release of financial information, the market will under-react or overreact to this news. While there are no certainties in the market, something that rarely happens is a perfect reaction – where the stock price jumps up or down to a new price after an earnings announcement and then stays there. What commonly happens is displayed below. One situation is where the stock price jumps high initially (over-reacts) and then drifts downward. This is shown as point 2 below. The other common market reaction is shown as point 3 where the price under-reacts and drifts to a new price over several days. The uncommon situation is point 1 – a “perfect” price movement that immediately assimilates the financial results. While we are showing upward movement, stocks will react positively and negatively to earnings announcements.

How did the stocks react to earnings announcements last quarter?
We wanted to understand the returns of the largest companies following the release of their earnings data last quarter. We focused on the 200 largest companies by market cap and looked at the returns over a few different periods.
- Earnings Date: This assumes that we purchase the company’s stock at the closing price prior to the company releasing their earnings announcement. For example, if a stock announced earnings after market close on Monday, this is the price return between Tuesday’s close and Monday’s close. On Monday, there was no information released but Tuesday’s market moves incorporate this newly released financial data.
- +3 Days: This is the 3-trading day return of a stock that includes the earnings date. As an example, if the company announced earnings on Monday after market close, it assumes you purchased at the close on Monday. Tuesday will be the ‘earnings date’ return. You will hold through Wednesday which is day +2 and sell at the market close on Thursday which is day +3.
- +5 / +10 / +20 Days: This is the 5-trading day return (or 10-trading day or 20-trading day) of a stock that includes the earnings date. 5-trading days is often one week and 20-trading days is usually one month.
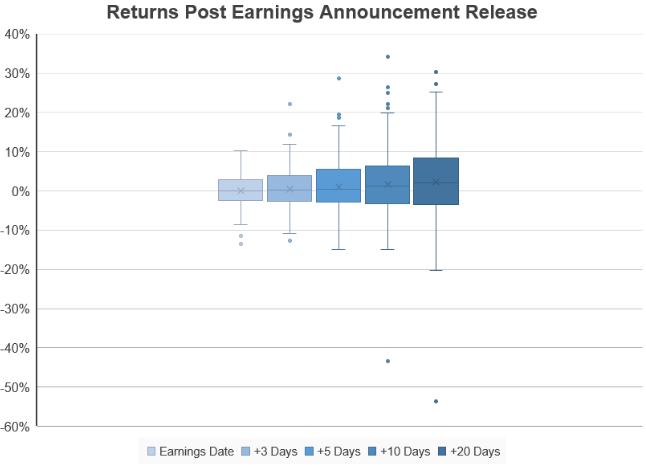
In the chart below, we show the ranges of returns for each of the time periods described above. A box plot, like the one below, shows the average return (the light blue x),1st quartile of returns (bottom of the box), 3rd quartile of returns (top of the box), along with the outliers that are higher and lower. For instance, on the earnings date, the average return was 0% while the 1st and 3rd quartile of returns ranges from -2.5% to +2.9%.
If you keep looking to the right, you will see ever widening ranges of returns. By the time you get to +20 days on the far right, the average return for a company across the 20-day trading period is +2.2% with the 1st and 3rd quartile of returns being -3.5% to +8.3%.
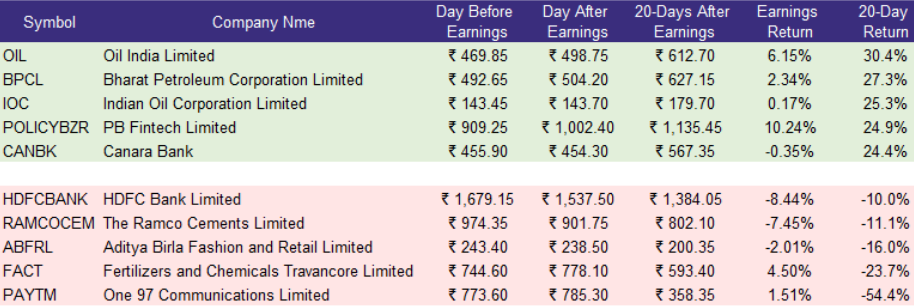
Now let’s look at some specific companies and their price performance. These are the top 5 companies and bottom 5 companies ranked by their 20-trading day return (including the announcement day). The top companies had returns from 24% to 30% associated with the earnings announcement day and the month that followed. The bottom companies had returns ranging from -10% to -54%. If you look at the ‘Earnings Return’ column which is the return on the day immediately following the announcement, you can see that there is significant volatility – some companies trade completely flat like IOC and CANBK while others like OIL or HDFCBANK saw dramatic moves.
Last quarter, how did the companies perform that were the most volatile after their earnings release?
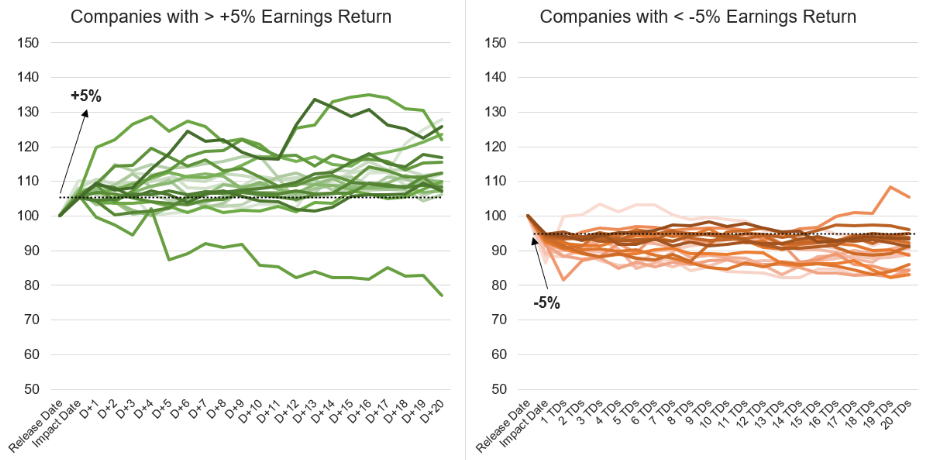
As we saw above, there can be significant price variability on the day after the earnings announcement. Sometimes, these large price movements can lead to a sustained trend for the subsequent few weeks. Looking at the same top 200 companies last quarter, we filtered on the earnings date return. There were 20 companies that had an earnings date return of more than 5% last quarter. The average 20-day post-announcement return for these companies was +11.3% which means that they generally continued to trend upwards following the initial positive earnings reaction. If you look at the illustration below, the left chart are the daily cumulative returns for these companies. Alternatively, there were 19 companies that had an earnings date return of less than 5% last quarter. These companies tended to drift downward for the next 20-trading days with an average cumulative return of -9.5%. In the illustration below, the right chart displays this.
How can you use this to be a more informed trader or investor?
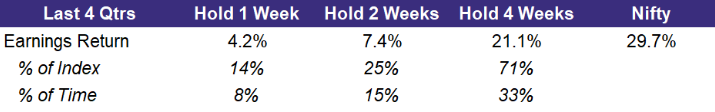
Since we’ve shown that stocks can move dramatically following the release of an earnings announcement, let’s take a look at recent history and compare it to the Nifty. In the table below, we display the average of a strategy where:
- You bought each of the top 200 companies by market cap at the market closing price of the stock just prior to the release of the earnings.
- You held the position through the earnings announcement for 1 week, 2 weeks, or 4 weeks.
- You did this each quarter for the last four quarters (through March 2024).
Over the last 4 quarters of earnings announcements, if you would have executed the strategy above and held for 1 week, you would have returned 4.2% for the past year. Instead, if you would have bought the Nifty and held for the past 4 quarters, you would have earned a return of approximately 30%. Your return of 4.2% is only 14% of what the Nifty delivered (4.2% / 30%). However, you only would have been in the market for 4 weeks (1 week per quarter) instead of having your capital at risk for the entire year. So, you would have been invested for only 8% of the year while earning 14% of what the Nifty returned.
On the other hand, if you executed the above strategy and decided to hold these 200 companies for 4 weeks following earnings each quarter, you would have returned over 21% over the last year. Again, with the Nifty returning nearly 30%, you would have underperformed by capturing 71% of the Nifty’s return. The interesting part is that you would only be invested in the markets for 4 months or 1/3 of the year while capturing 3/4 of the Nifty’s return.
Of course, past performance isn’t indicative of future returns and this only represents one year of historical data. In addition, this basic strategy involves taking substantial risk by purchasing stocks leading into a volatile market day. The intent of this is to show that the days surrounding earnings can drive the majority of your yearly returns.
About The Author
Next Story