Market News
Dr Reddy’s Q3 results: Net profit likely to decline 20 to 22% amid weak US market sales; check key technical levels
.png)
4 min read | Updated on January 21, 2026, 09:17 IST


SUMMARY
Dr Reddy’s Laboratories is expected to report subdued results for Q3 FY26. Revenue is expected to remain largely flat due to weak sales in the US, which will be partly offset by strong growth in the domestic market. Net profit is expected to fall sharply on a yearly basis as margins continue to come under pressure. Dr Reddy’s stock weak technical outlook will keep sentiment cautious ahead of the results announcement.

Dr Reddy’s net profit is expected to decline by 20–22% YoY to ₹1,085–₹1,110 crore
Indian pharmaceutical giant Dr Reddy’s Laboratories is set to unveil its Q3 FY26 results on 21 January. The company is expected to report subdued earnings for the third quarter, due to lower sales in the US markets.
According to experts, Dr Reddy’s Laboratories' Q3 revenue is most likely to remain flat, rising just 0.5–1% year on year (YoY) to ₹8,390–8,425 crore, mainly due to a 13–20% decline in sales in US markets and a negligible contribution from the Revlimid drug. The company registered revenues of ₹8,828 crore in Q2 FY26 and ₹8,381 crore in the same quarter last year.
The domestic market is expected to contribute more to the company’s business, offsetting the impact of weak sales in the US market with revenue growth of 11–13% year on year (YoY), aided by strong sales momentum.
However, Dr Reddy’s net profit is expected to decline by 20–22% year on year to ₹1,085–₹1,110 crore, compared to the ₹1,414 crore net profit reported in the December quarter last year. Its net profit was ₹1,347 crore in the previous quarter.
Investors will be closely monitoring management commentary on new drug approvals and launches, as well as key performance metrics such as EBITDA margins. Progress on US contract manufacturing partnerships will also be monitored closely, as these could help the company to offset US tariff-related risks.
Ahead of the Q3 results announcement, Dr Reddy’s shares closed 0.4% higher at ₹1,172 on 20 January. So far this month, Dr Reddy's shares have fallen by over 8%.
Technical outlook
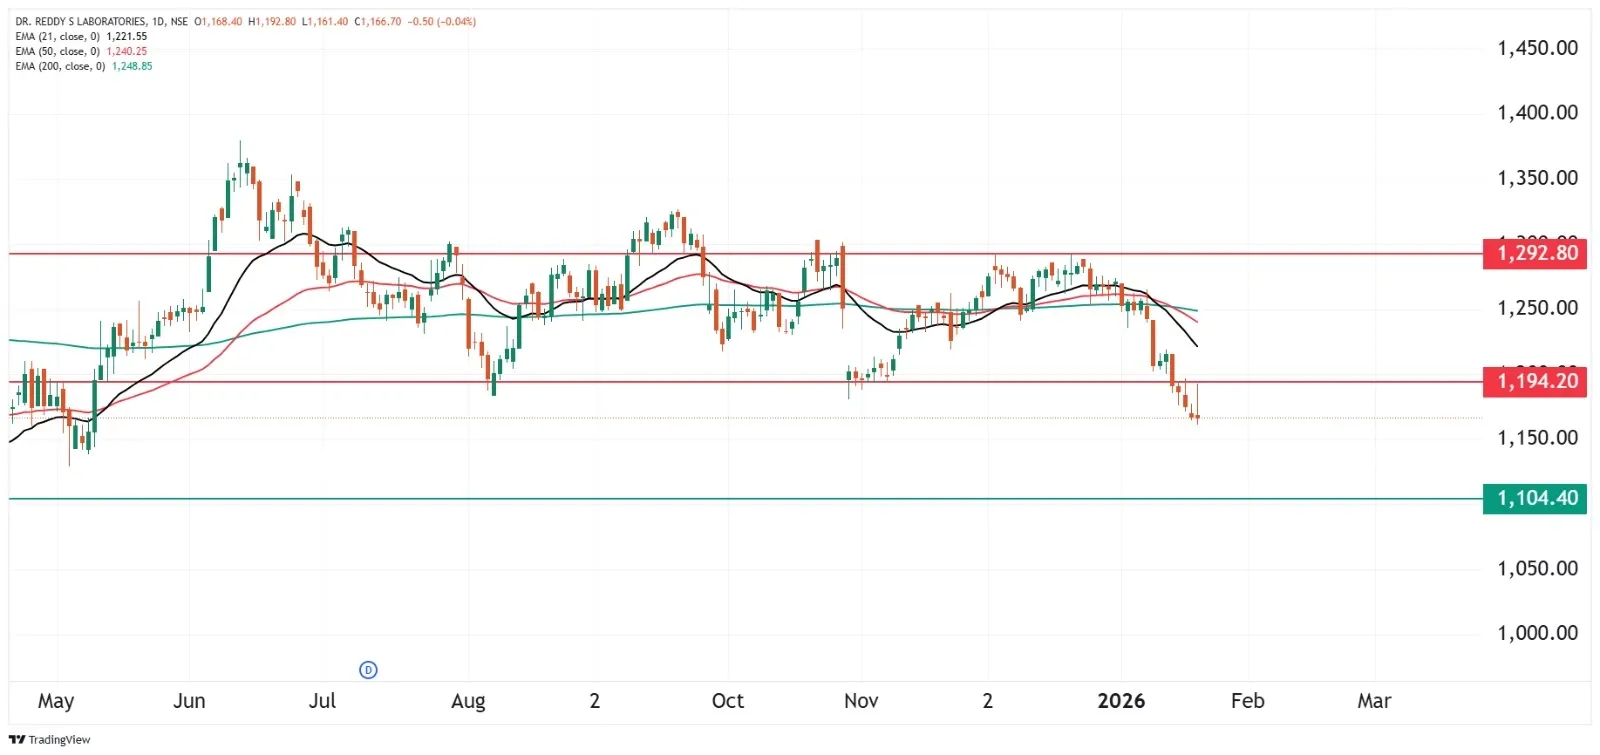
The technical structure of Dr Reddy's Laboratories is showing clear short-term weakness, with the price falling below the ₹1,195 support level. The stock is trading below the 21- and 50-day exponential moving averages (EMAs), indicating a loss of momentum and a bearish bias. The EMAs are rolling over, with the 21-EMA crossing below the 50-EMA. Meanwhile, the price remains well below the 200-EMA, which signals a downtrend. Unless the stock reclaims the ₹1,195–₹1,210 zone on a closing basis, the overall structure may remain weak.
Options outlook
Based on options data of 27 January, the significant call open interest (OI) was seen at 1260 and 1300 strikes, while the PUT OI was placed at 1100 strikes. This indicates that the broader positioning as per the data remains bearish.
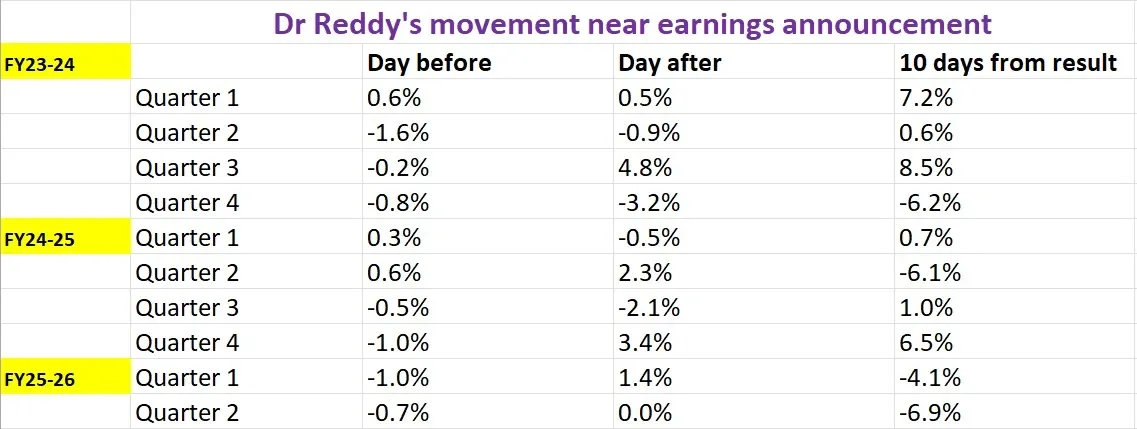
Dr Reddy’s Laboratories 27 January ATM strike is at 1170, with both the call and put options priced at ₹46. This suggests an implied price movement of roughly ±3.9% as of 20 January’s closing price. However, before planning any strategies, let's take a look at Dr Reddy’s historical price behaviour during past earnings announcements.
Options strategy for Dr Reddy’s Laboratories
With the options market predicting a price movement of ±3.9% till 27 January, traders can consider long and short straddle strategies to take advantage of the expected volatility.
A long straddle involves buying both an at-the-money call and put option on Dr. Reddy’s with the same strike price and expiry date. This option buying strategy will profit if the share price moves significantly more than ±3.9% in either direction.
Conversely, if you expect Dr. Reddy’s to remain range-bound and move less than ±3.9% till 27 January expiry, consider a short straddle strategy. This involves selling an ATM call and a put option with the same strike price and expiry date. The strategy will profit from the fall in volatility if the stock moves less than ±3.9% before the options expire.
Disclaimer:
Derivatives trading must be done only by traders who fully understand the risks associated with them and strictly apply risk mechanisms like stop-losses. The information is only for educational purposes. We do not recommend any particular stock, securities and strategies for trading. The stock names mentioned in this article are purely for showing how to do analysis. Take your own decision before investing.
About The Author
Next Story


