Market News
MCX Crude oil slips as markets brace for Donald Trump’s second presidential term; check today's trade setup
.png)
4 min read | Updated on January 20, 2025, 17:39 IST
SUMMARY
After a sharp rally of four-weeks, the West Texas Intermediate (WTI) formed a doji candle on the weekly chart, reflecting pause and indecision among investors. Going forward, all eyes will be on the U.S. President-elect Donald Trump, who will take charge as the 47 President of the U.S. later today.

Oil prices are trading lower on Monday, with Brent Futures trading around $80.44, down 0.45%.
Market recap (as of 5:30 pm)
- Gold 5 Feb Futures: ₹78,984/ 10 gram (▼ 0.06%)
- Silver 5 March Futures: ₹91,275/ 1 kg (▼ 0.36%)
- Crude Oil 19 Feb Futures: ₹6,682/ 1 BBL (▼ 0.37%)
As per reports, Trump reiterated his plans to increase US energy production during a rally on Sunday. In 2024, crude oil production in the US will be around 13 million barrels per day. It should be noted that the recent US sanctions on the Russian oil sector could affect supplies to the global market.
Technical structure
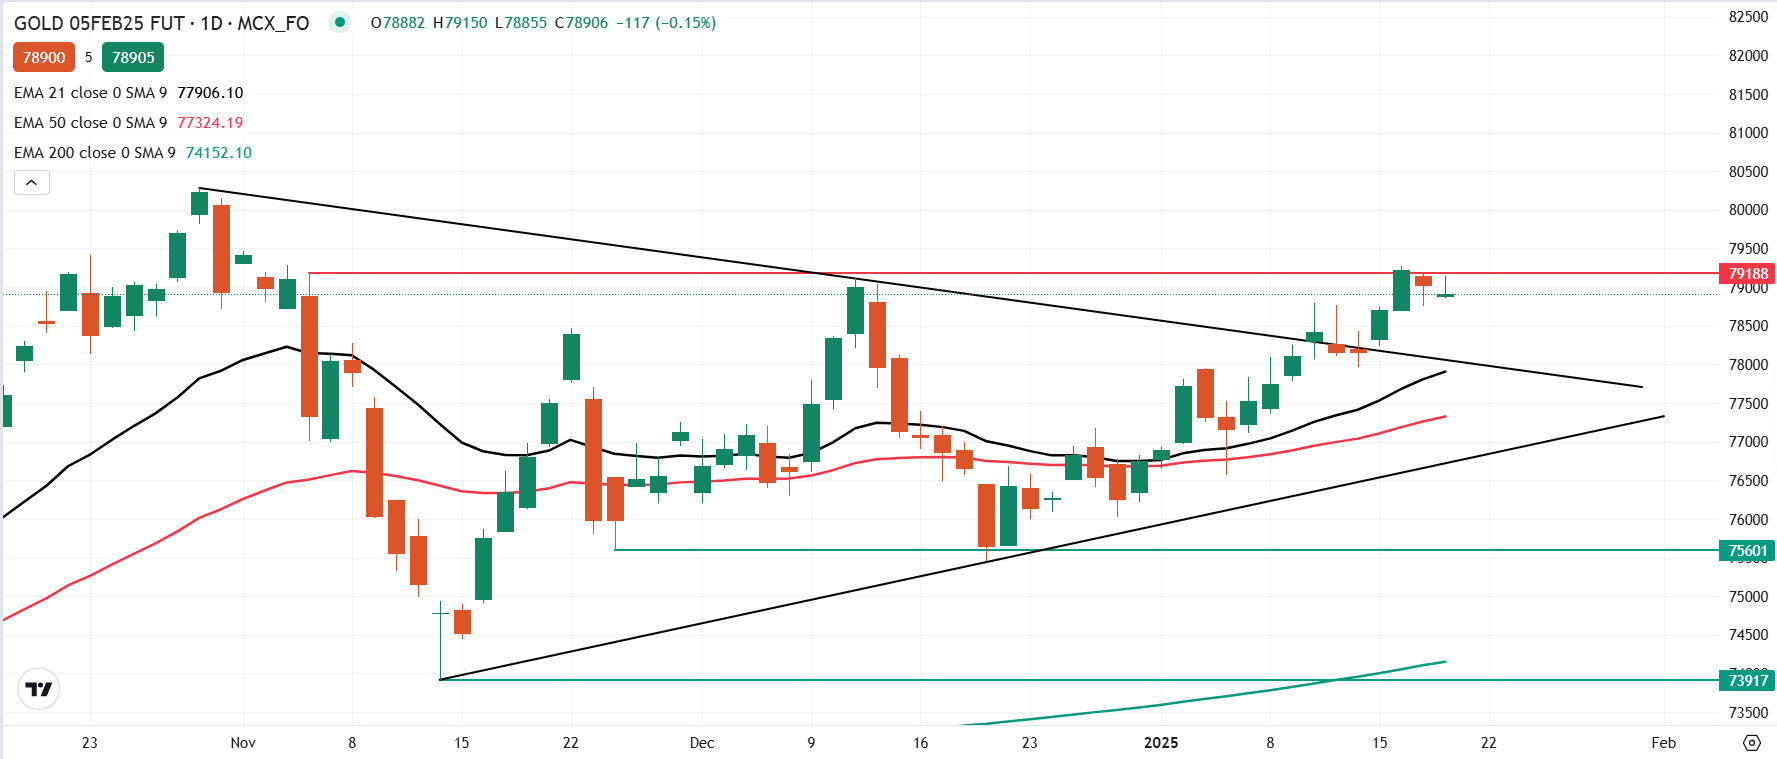
Meanwhile, the technical structure of the gold as per 5 February’s Futures contract witnessed resistance around the ₹79,200 zone. This comes after the breakout from the downward sloping trendline. The broader structure of the gold remains bullish unless it slips below the support zone of ₹78,000.

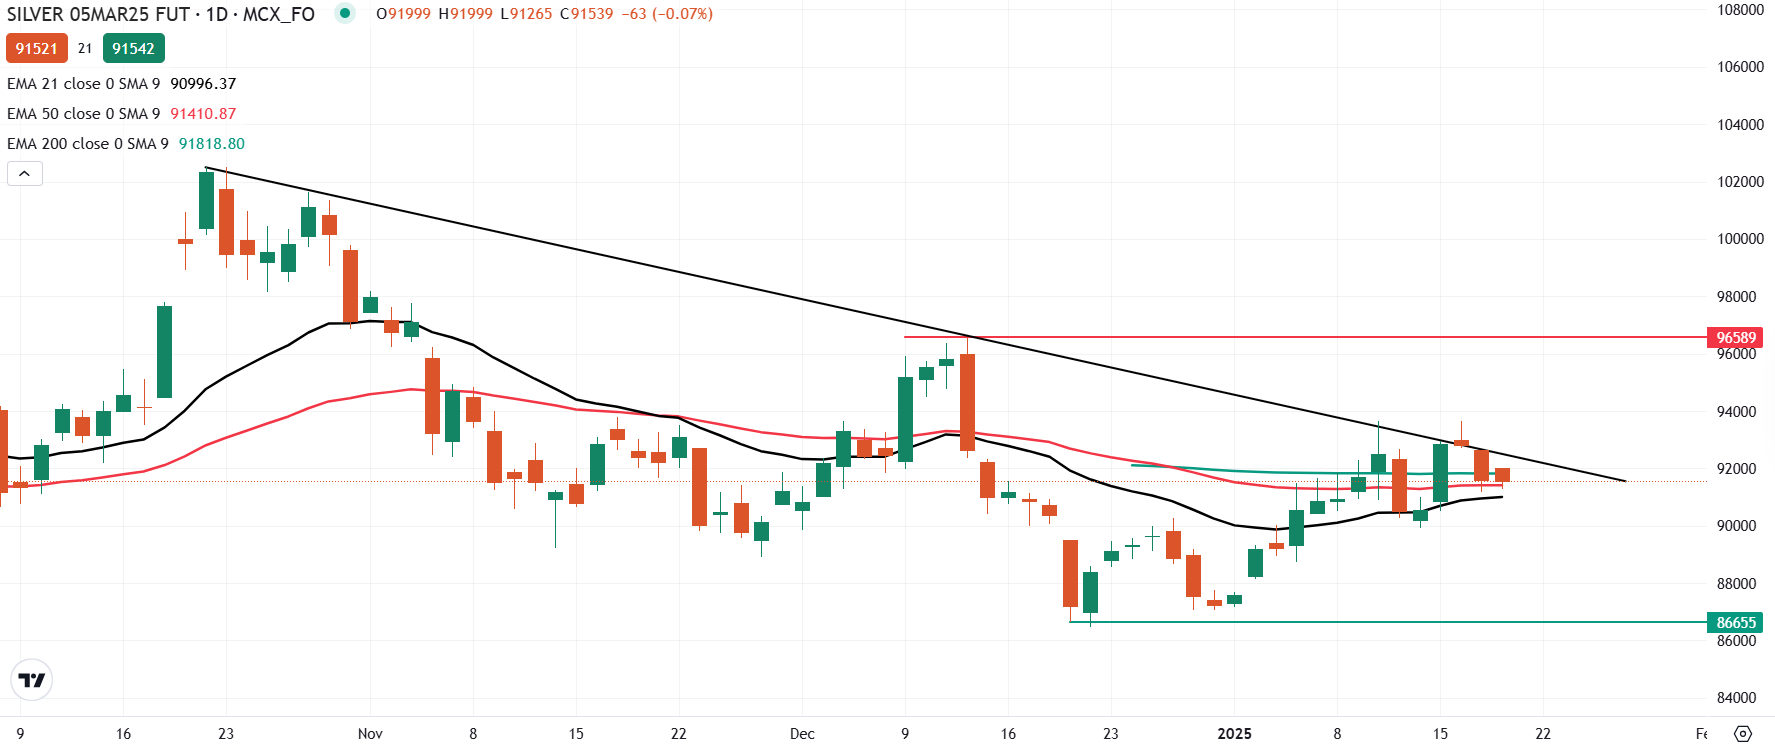
Similarly, Silver failed to breakout from the downward sloping trendline as highlighted on the chart below and formed a shooting star pattern on the daily chart of its 5 March Futures contract on MCX. A shooting star is a bearish reversal pattern which gets confirmed if the close of the subsequent candle is below the low of the reversal pattern.
Currently, Silver is trading near its crucial support zone of 21 EMA and a close below this strengthens the weakness. On the flip side, a close above the resistance zone of ₹93,600 will signal strength.

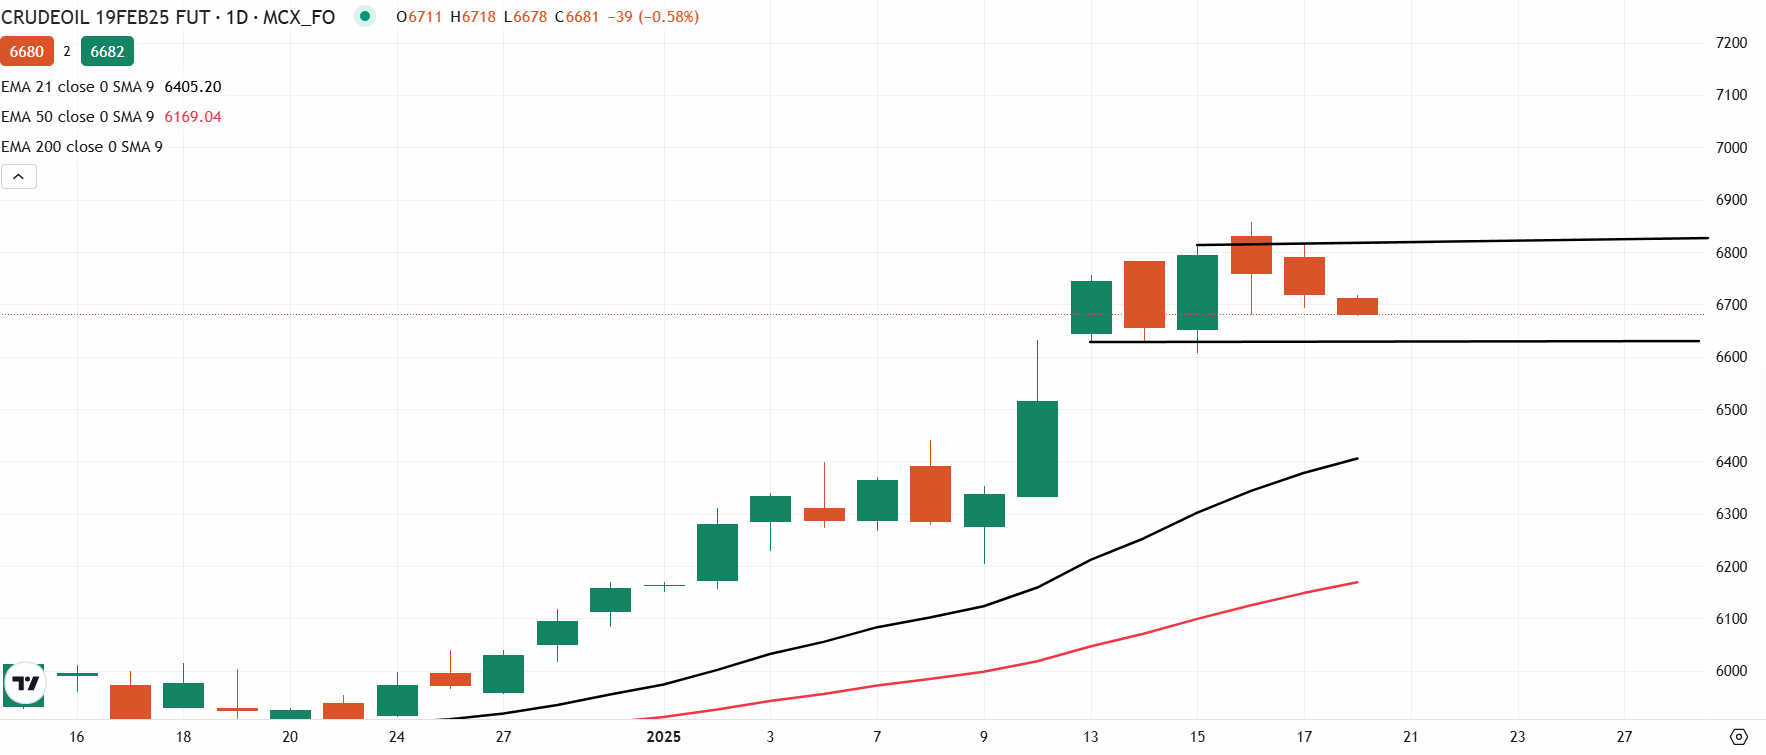
Meanwhile, the technical structure of the Crude futures on MCX remains sideways with immediate support around the 6,600. If crude slips below this zone on a closing basis, then it may retest its 21 EMA. On the other hand, the bullish trend will resume if it breaches 6,850 on a closing basis.

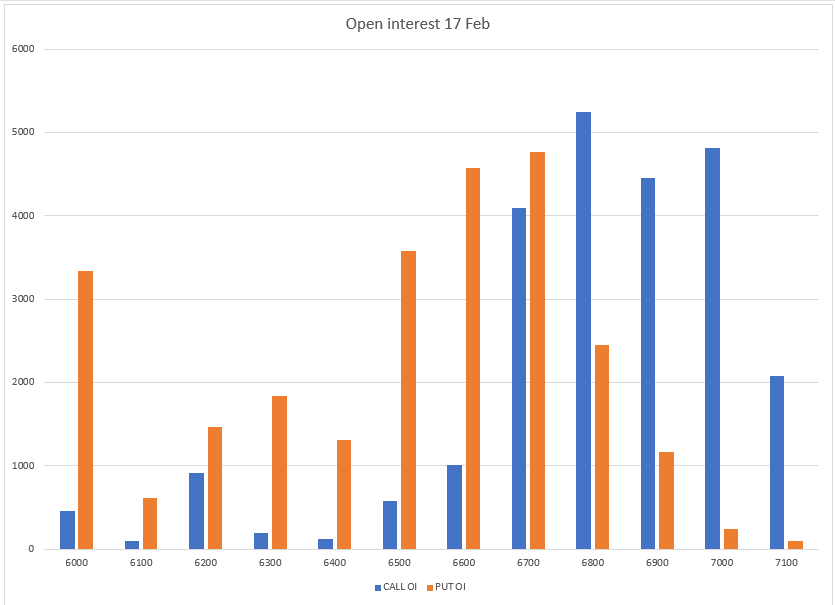
The open interest data for the 17 February expiry saw significant call build-up at 6,800 and 7,000 strikes, indicating emergence of sellers around these levels. This indicates that the crude oil may take resistance around these zones. On the flip side, the put base was seen at 6,700 and 6,600 strikes, suggesting support for crude around these levels.

Disclaimer:
Derivatives trading must be done only by traders who fully understand the risks associated with them and strictly apply risk mechanisms like stop-losses. The information is only for the client's consumption, and such material should not be redistributed. We do not recommend any particular stock, securities, or strategies for trading. The securities quoted are exemplary and are not recommendatory. The stock names mentioned in this article are purely to show how to do analysis. Take your own decision before investing.
About The Author
Next Story


