Election Results
Lok Sabha Election Results day trade setup for NIFTY50 and BANK NIFTY: Key levels to watch
.png)
5 min read | Updated on June 04, 2024, 08:34 IST


SUMMARY
Foreign Institutional Investors (FIIs) were net buyers on June 3, injecting over a record ₹6,000 crore into the cash market. This is the highest single-day buying since March 2024. In the coming days, it will be important to monitor FII activity in the cash market to gauge the near-term direction of the index.
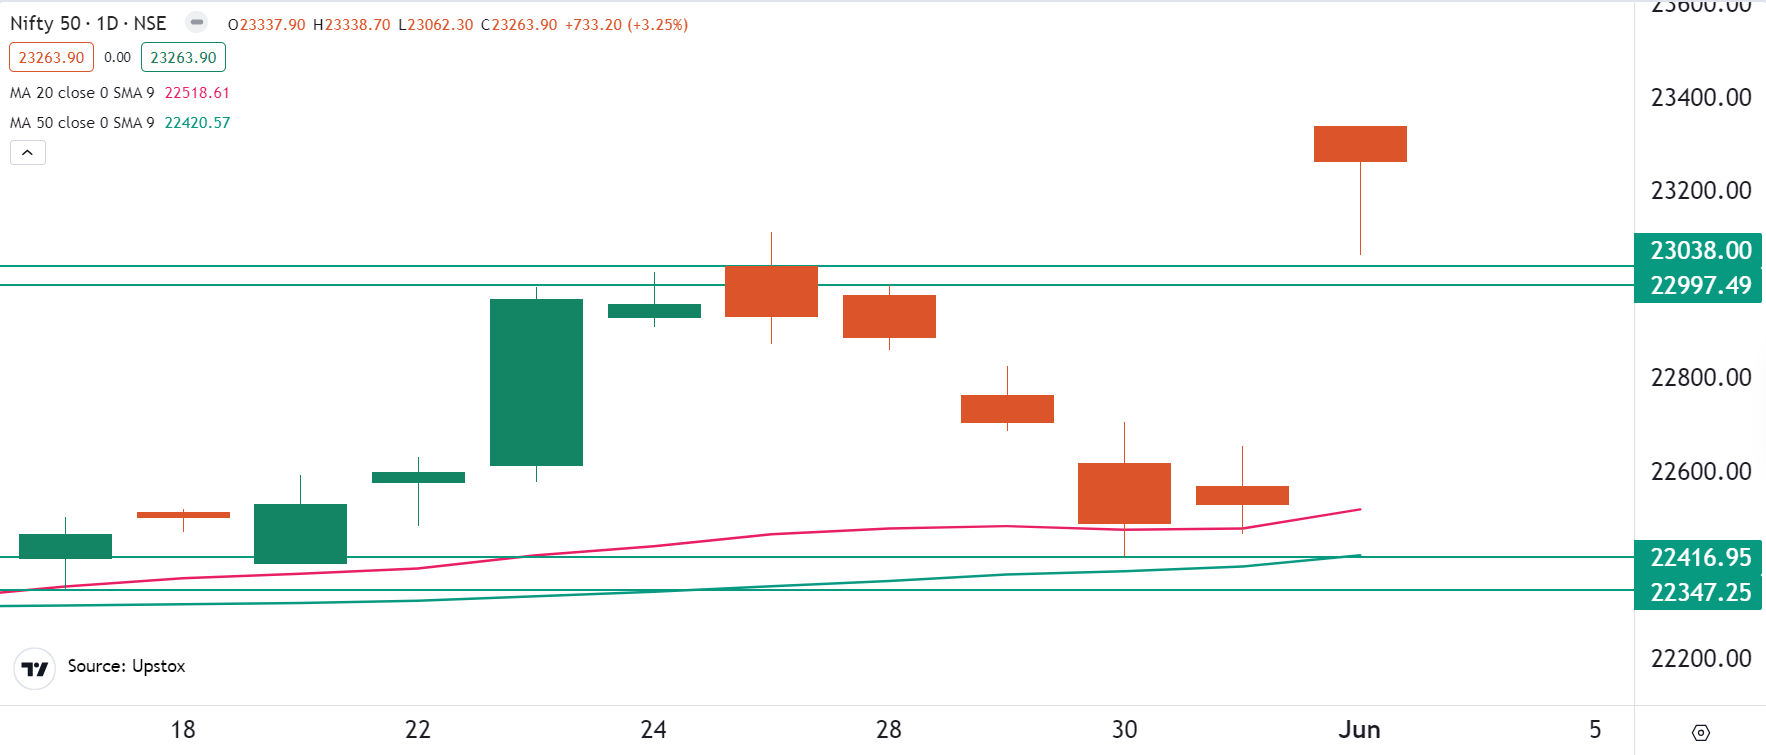
On the daily chart, the NIFTY50 index formed a hanging man candlestick pattern.
Asian markets update 7 am
The GIFT NIFTY is up 0.4%, suggesting a gap-up opening for Indian equities as the nation awaits the results of general elections. In contrast, other Asian markets are struggling. Japan's Nikkei 225 is down 0.8% and Hong Kong's Hang Seng Index is down 0.1%.
U.S. market update
- Dow Jones: 38,571 (▼0.3%)
- S&P 500: 5,283 (▲0.1%)
- Nasdaq Composite: 16,828 (▲0.5%)
U.S. stocks ended on a mixed note on Monday after the manufacturing sector contracted to 48.7 in May, against expectations of 49.6. A reading below 50 indicates contraction.
NIFTY50
- June Futures: 23,407 (▲3.3%)
- Open Interest: 5,75,599 (▼3.3%)
The NIFTY50 started the week on a bullish note, opening with a gap-up of over 3%. After initial profit booking, the index maintained its opening gains and closed above the psychologically crucial 23,000 mark. The strong optimism was led by exit polls predicting a third-term for the BJP-led NDA, better-than-expected GDP data and recond GST collections.
However, on the daily chart, the NIFTY50 index formed a hanging man candlestick pattern. A hanging man is a bearish reversal pattern which appears after an uptrend. This pattern indicates selling pressure is beginning to outweigh the buying pressure at higher levels. However, traders wait for the confirmation of the pattern, which occure if the index closes below the hanging man’s low.
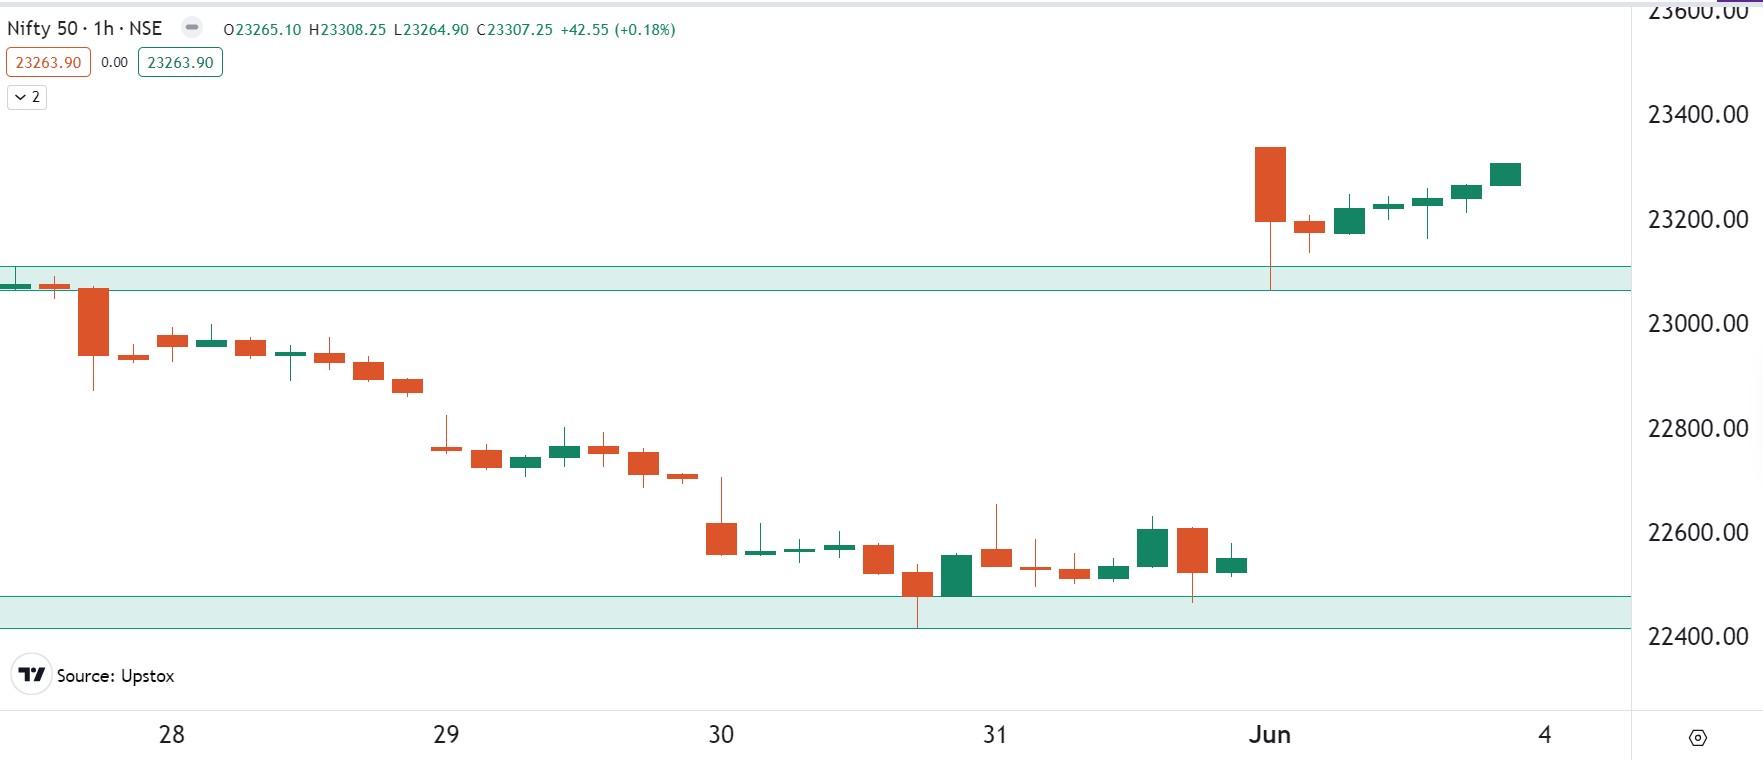
For today's session, we have marked the key levels on the hourly chart of the NIFTY50. As you can see on the chart, the index has immediate support between 22,900 and 23,000. This zone coincides with the low of yesterday's Hanging Man low. A close below this zone will indicate weakness. On the other hand, if the index protects this zone on a closing basis, the momentum could remain strong.
It is important to note that the exit polls are the projections of the seats the BJP-led NDA is expected to win. The experts believe iff the election outcome are in line or slightly below the exit poll predictions, the market could come under mild to severe selling pressure. Conversely, if the NDA wins substantially more seats than the exit poll, we may be in for another upswing.
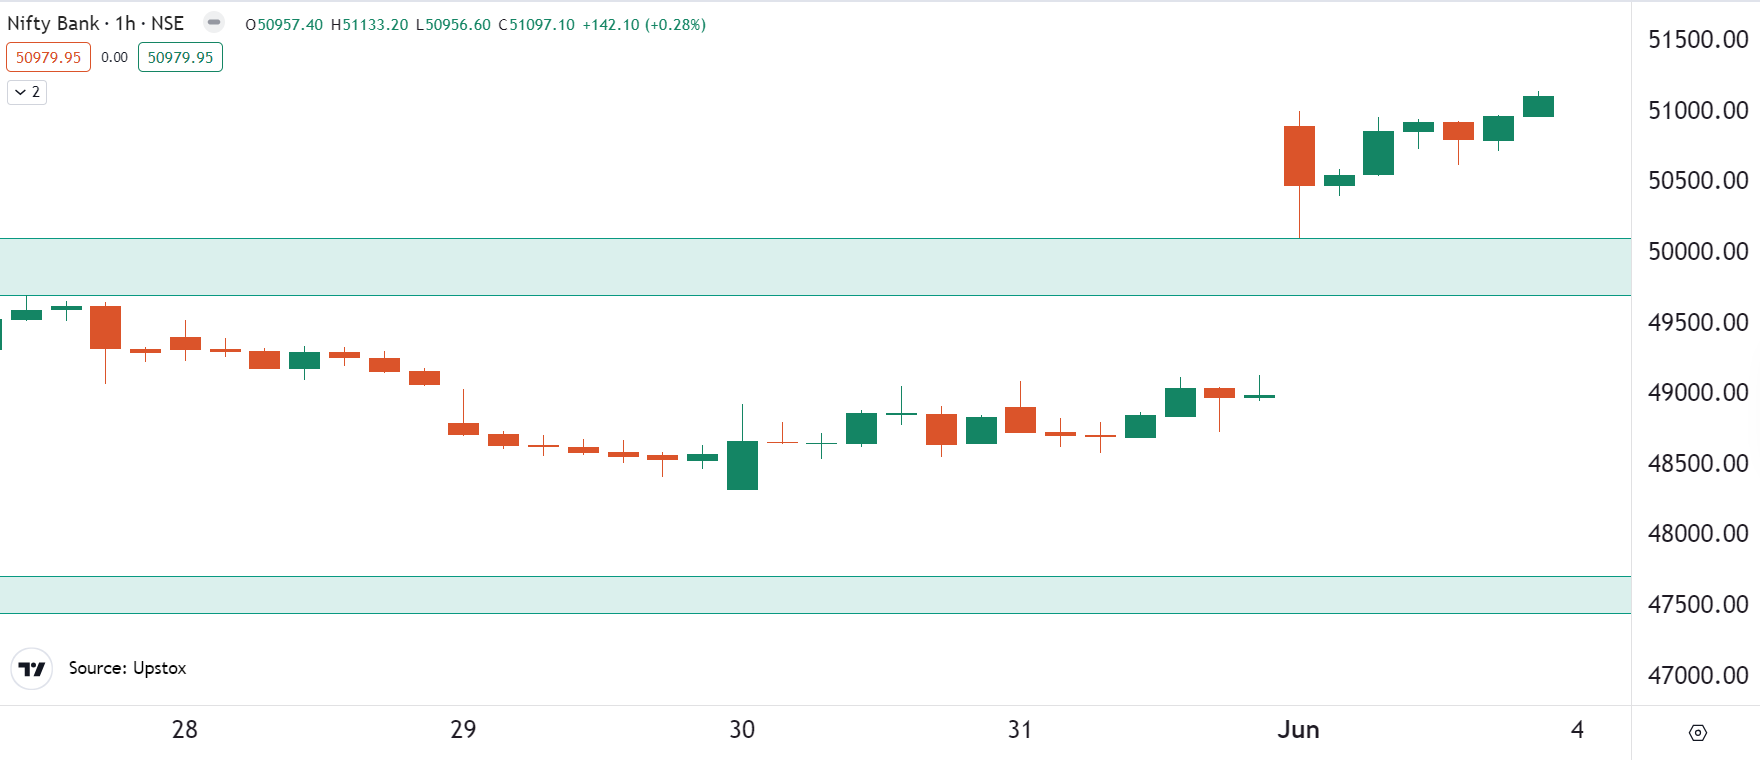
BANK NIFTY
- June Futures: 51,283 (▲4.3%)
- Open Interest: 1,51,733 (▲0.3%)
The BANK NIFTY also started the day on a bullish note, opening 4% higher. After an initial dip, the index gradually moved past the opening level of 50,898 to close above 51,000, led by strong gains in PSU banks.
On the daily chart, the index has formed a large lower shadow, indicating the presence of buyers around the lower levels. However, given the sharp upward movement, traders should remain cautious about profit-booking in the second half of the trading session.
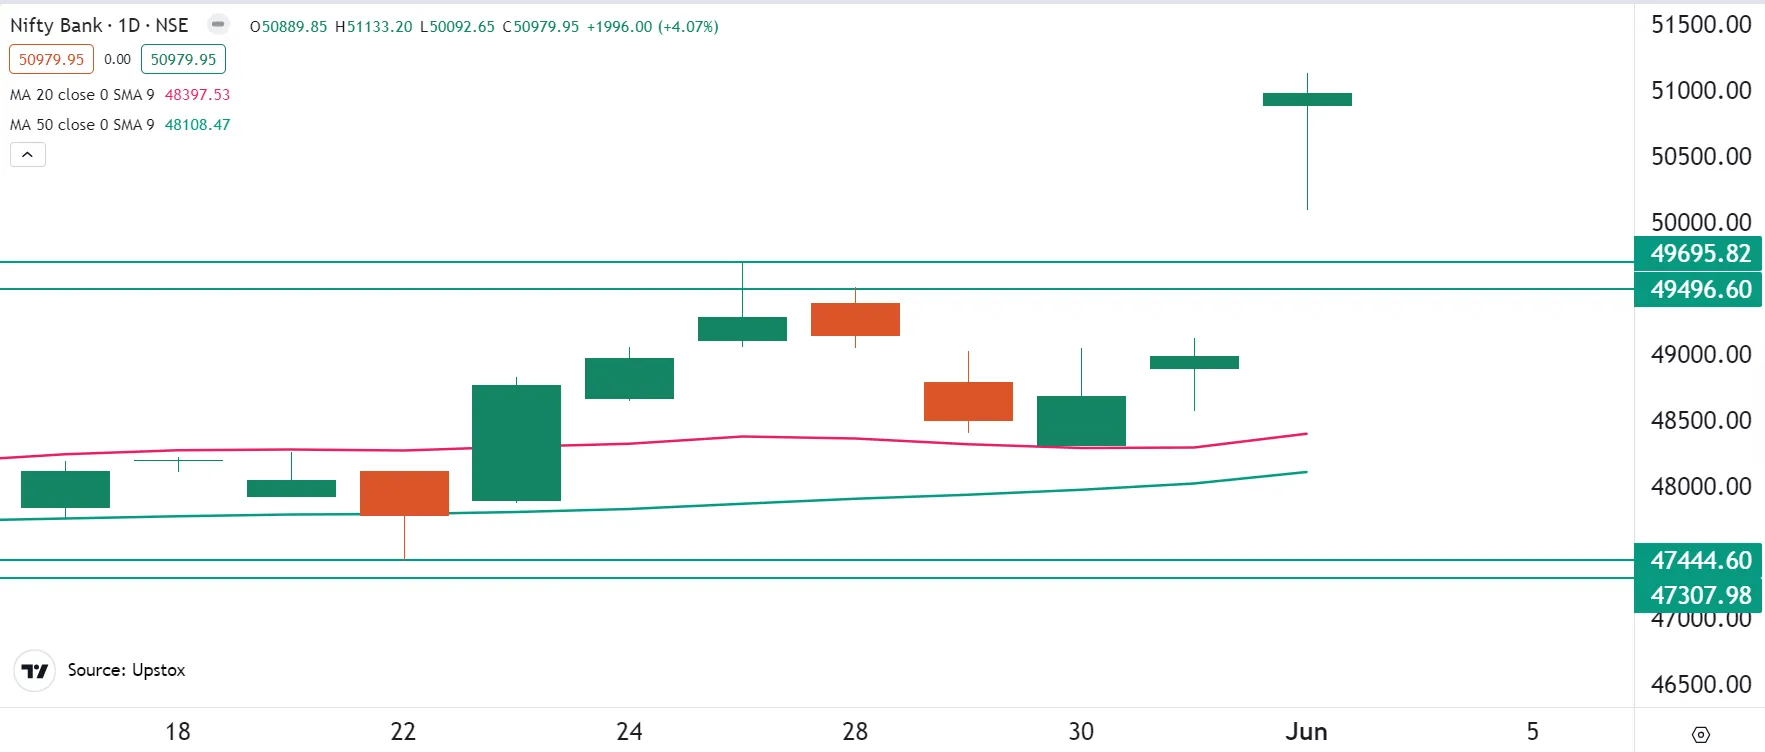
On the hourly chart, the index has immediate support between the 50,000 and 49,000 zones. With the index flying high in the all-time high zone, traders should wait for price action and the entry of sellers to confirm resistance at higher levels. Positional traders can also keep an eye on the support zone mentioned above on a closing basis. A close below this level indicates weakness, but if the index protects this zone on a closing basis, buyers will continue to dominate.
FII-DII activity
Stock scanner
Long build-up: Hindustan Petroleum, Godrej Properties, Vodafone-Idea, HDFC AMC and Indus Towers
Short build-up: Eicher Motors and Ipca Laboratories
Under F&O ban: Zee Entertainment
In Futures and Options or F&O, long build-up means an increase in Open Interest (OI) along with an increase in price, and short build-up means an increase in Open Interest(OI) along with a decrease in price.
Source: Upstox and NSE.
Disclaimer: Derivatives trading must be done only by traders who fully understand the risks associated with them and strictly apply risk mechanisms like stop-losses. The information is only for consumption by the client and such material should not be redistributed. We do not recommend any particular stock, securities and strategies for trading. The securities quoted are exemplary and are not recommendatory. The stock names mentioned in this article are purely for showing how to do analysis. Take your own decision before investing.
About The Author
Next Story
