Market News
MCX Gold trades around ₹1.47 lakh per 10 gram, Silver breaks key support; check trade setup for Oct 14

4 min read | Updated on October 14, 2026, 14:22 IST


SUMMARY
Gold and silver are attempting small rebounds after sharp declines, but their MCX charts continue to favour sellers. Globally, attention is on US inflation data due later today for clues on the Federal Reserve’s next move. Oil supply concerns also remain in focus following an attack on a Saudi Aramco facility.

MCX Crude Oil 19 October futures were near ₹8,944, holding above the descending trendline but struggling to sustain above ₹9,000.
Market recap (as of 2:00 pm)
- Gold 4 Dec Futures: ₹1,47,893/ 10 gram (▼ 0.3%)
- Silver 4 Dec Futures: ₹2,17,242/ 1 kg (▼ 0.9%)
- Crude Oil 19 Oct Futures: ₹8,975/ 1 BBL (▲ 0.2%)
Technical outlook
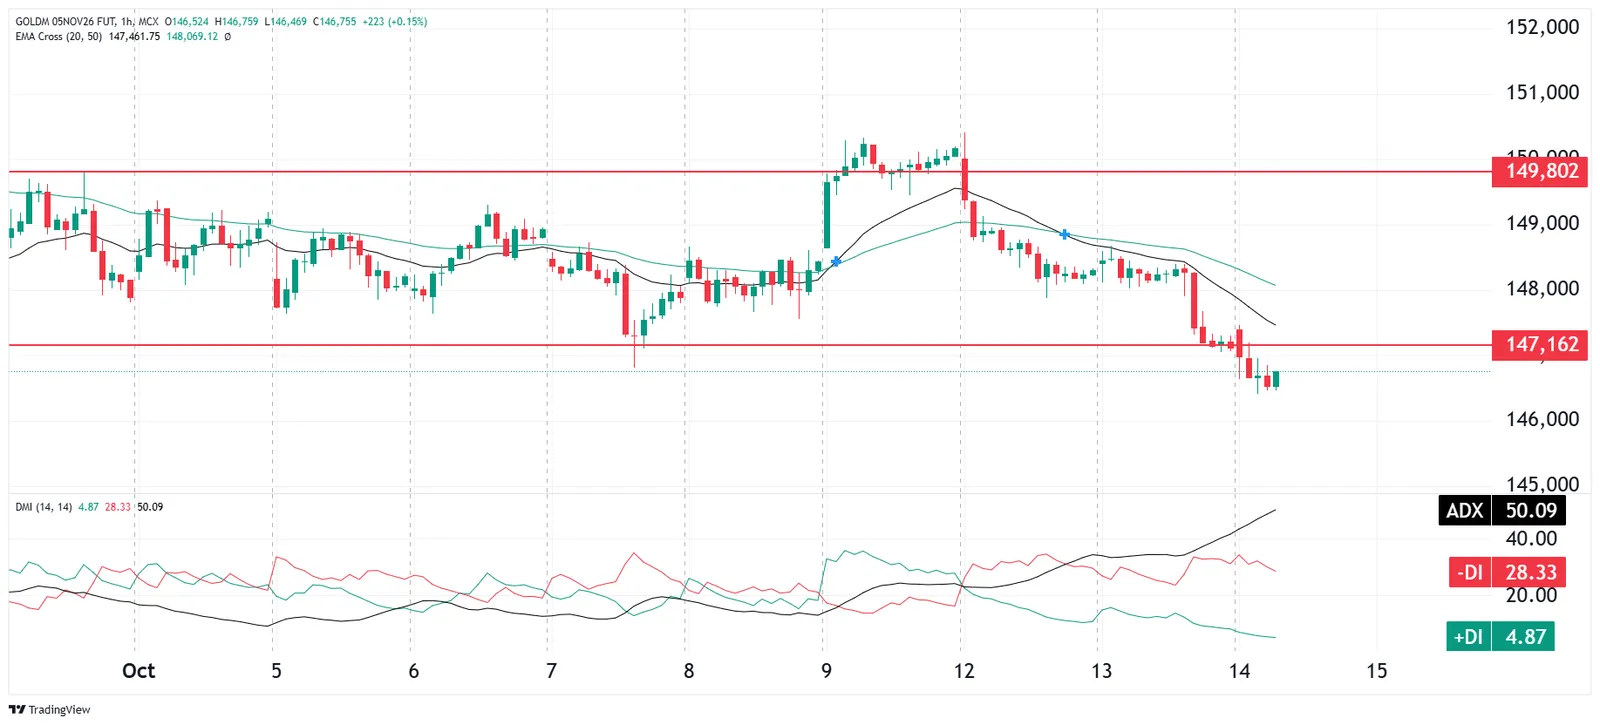
MCX Gold Mini 5 November futures were near ₹1,46,755, remaining under pressure after breaking below the support at ₹1,47,162. Price is below its 20 hour and 50 hour EMAs. Both averages are declining, with the shorter average below the longer average, adding to the weakness. Meanwhile, negative DI remains above positive DI, while ADX at 50.09 indicates a strong downtrend.
An hourly close above ₹1,47,162 would signal initial stabilisation, followed by the resistance zone at ₹1,47,462–₹1,48,069. On the downside, the recent low around ₹1,46,400 is the immediate area to watch. Sustained weakness below it could extend the decline.
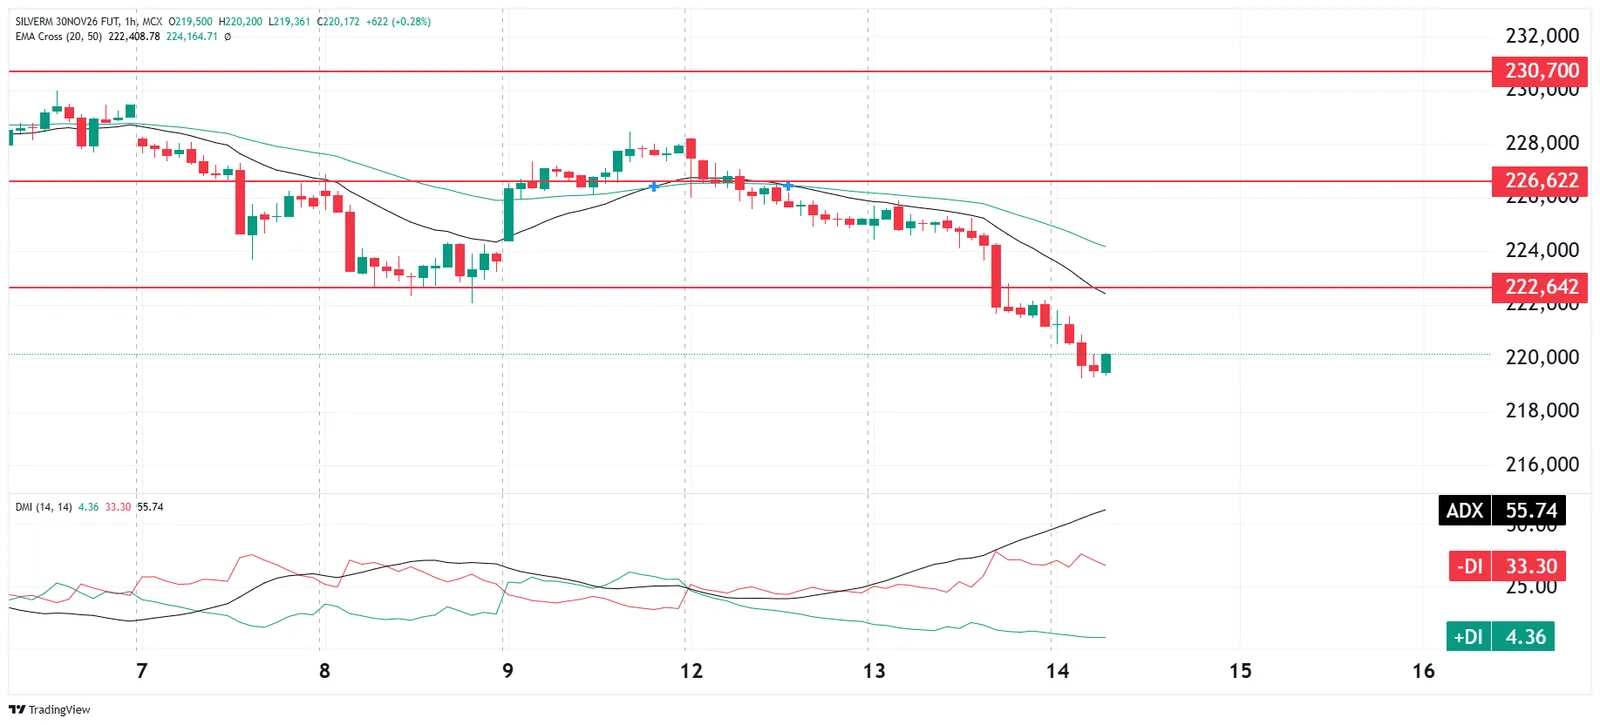
MCX Silver Mini 30 November futures were near ₹2,20,172, attempting a small rebound after breaking below the support at ₹2,22,642. Price remains below its declining 20 hour and 50 hour EMAs, with the shorter average below the longer average. Meanwhile, negative DI remains well above positive DI, while ADX at 55.74 indicates a strong downtrend.
An hourly close above ₹2,22,409–₹2,22,642 would signal an initial recovery, with the 50 hour EMA near ₹2,24,165 the next hurdle. On the downside, the recent low around ₹2,19,300 is the immediate area to watch. Sustained weakness below it could trigger further selling.
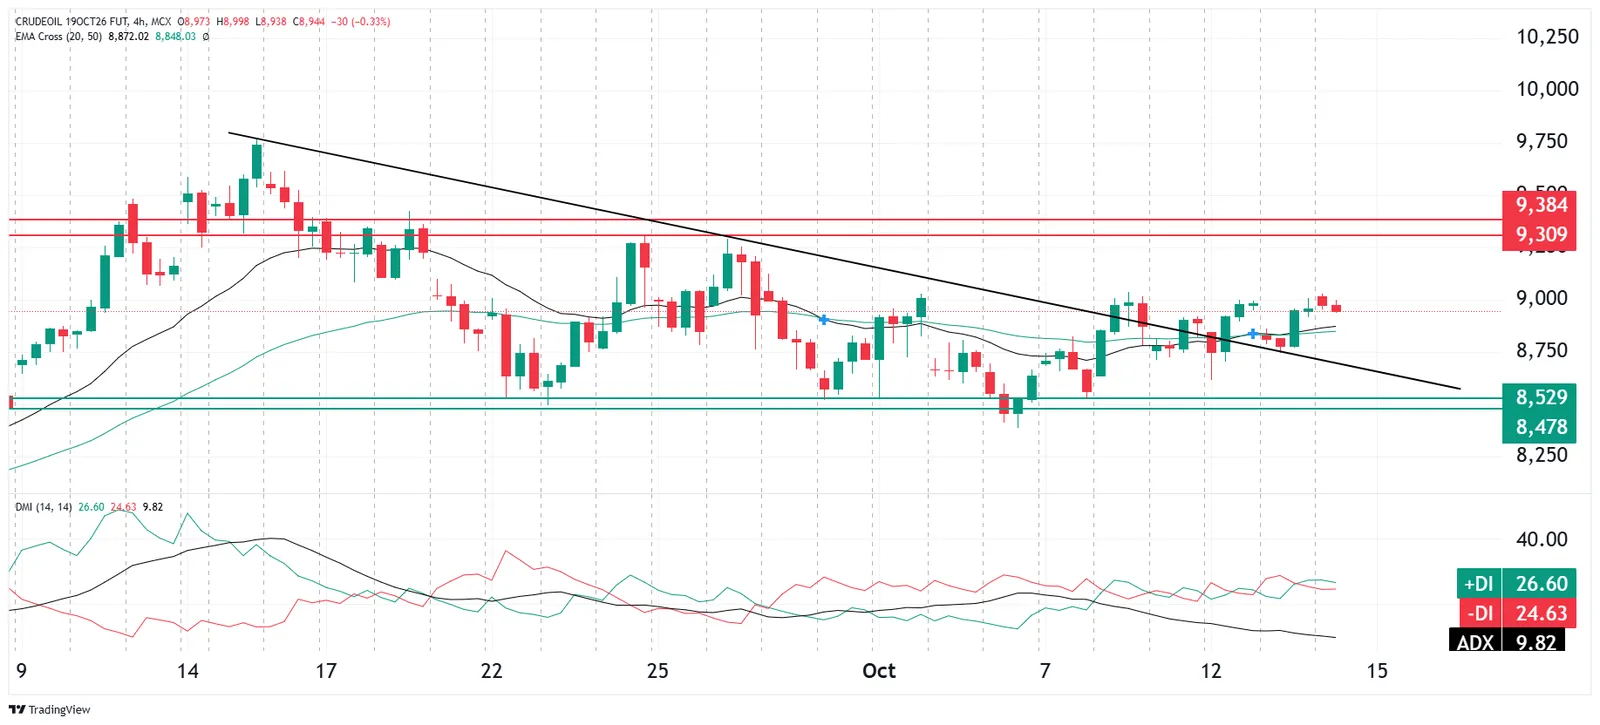
MCX Crude Oil 19 October futures were near ₹8,944, holding above the descending trendline but struggling to sustain above ₹9,000. On the four hour chart, price is above its 20 period and 50 period EMAs, with the shorter average marginally above the longer average. Meanwhile, positive DI is slightly above negative DI, while ADX at 9.82 indicates a lack of directional strength.
Crude remains range bound with a modest positive bias while holding above the moving averages. A close above ₹9,000 would signal improving buying momentum, with ₹9,309–₹9,384 the next resistance zone. On the downside, ₹8,848–₹8,872 is the immediate area to watch. Sustained weakness below it would bring the descending trendline into focus.
About The Author
Next Story