return to news
  1. MCX Gold rises over 2% to trade near ₹1.42 lakh, Silver jumps nearly 4% driven by weaker US dollar; check trade setup for Nov 4

Market News

MCX Gold rises over 2% to trade near ₹1.42 lakh, Silver jumps nearly 4% driven by weaker US dollar; check trade setup for Nov 4

Upstox logo

4 min read | Updated on November 04, 2026, 14:26 IST

SUMMARY

MCX Gold Mini and Silver Mini have strengthened, with both trading above their 20 and 50-hour EMAs and approaching immediate resistance at ₹1,41,601 and ₹1,87,443, respectively. Crude Oil remains weak, trading below both hourly EMAs, with ADX pointing to a strong downtrend.

Stock list

GOLD
--
CRUDEOIL
--
Gold-silver-price-live

MCX Crude Oil 19 November futures is trading below 20 hour and 50 hour EMA.

Market recap (as of 4:00 pm)

  • Gold 4 Dec Futures: ₹1,42,598/ 10 gram (▲ 2.2%)
  • Silver 4 Dec Futures: ₹1,86,777/ 1 kg (▲ 3.9%)
  • Crude Oil 19 Nov Futures: ₹9,084/ 1 BBL (▼ 0.2%)
Gold: The yellow metal is trading higher in the international market as the Gold spot prices traded around $4,031 per ounce, up 2.3%. Meanwhile, Silver traded 3.8% higher at $51.6 per ounce in the US markets. Gold prices surged today following a weaker US dollar after Democrats seized control of both the Senate and House in US midterm elections, while investors await non-farm payrolls data for clues to the Federal Reserve’s policy path.
Open FREE Demat Account within minutes!
Join now
Crude oil: International crude oil prices are trading flat, with Brent Futures trading around $103.6 per barrel, up 0.1%, while WTI Crude traded 0.04% higher, around $96.1. Oil prices are trading in a range as investors remain cautious and assess the US midterm election results and their potential impact on peace talks in the Middle East.

Technical outlook

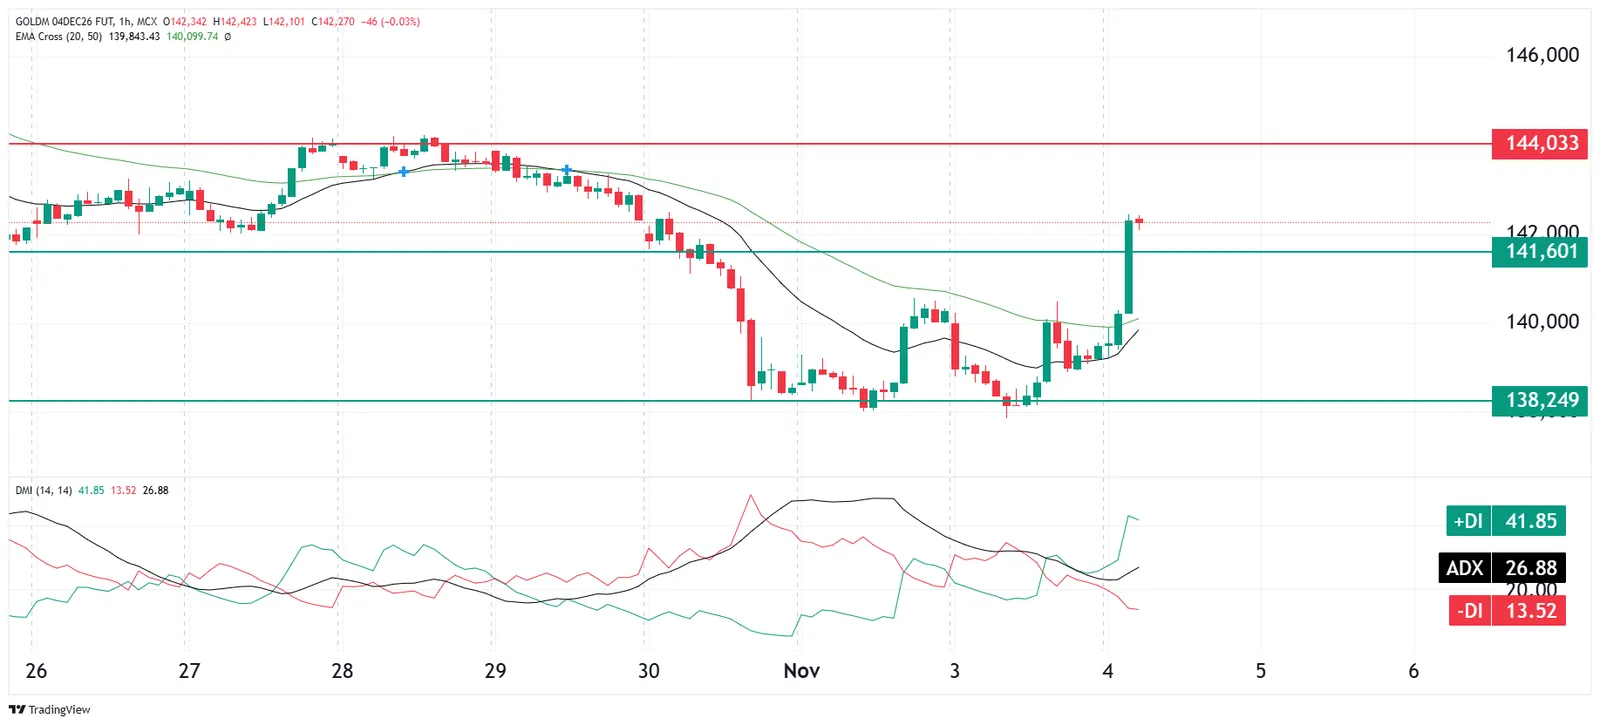
MCX Gold Mini 4 December futures are trading near ₹1,41,322, having rebounded from the ₹1,38,249. Price is above the 20 hour EMA (exponential moving average) and the 50 hour EMA, which points to improving short-term structure, although the 20 EMA is still below the 50 EMA, so the broader hourly trend has yet to fully turn. Meanwhile, ADX at 24.29 indicates an emerging trend with buyers in control.

A sustained move above ₹1,41,601 could turn the structure more bullish with immediate support at ₹1,38,249. However, an hourly close below ₹1,38,249 would weaken the recovery and shift the structure back to negative.
GOLDM-04DEC26-FUT_2026-11-04_12-14-03.webp

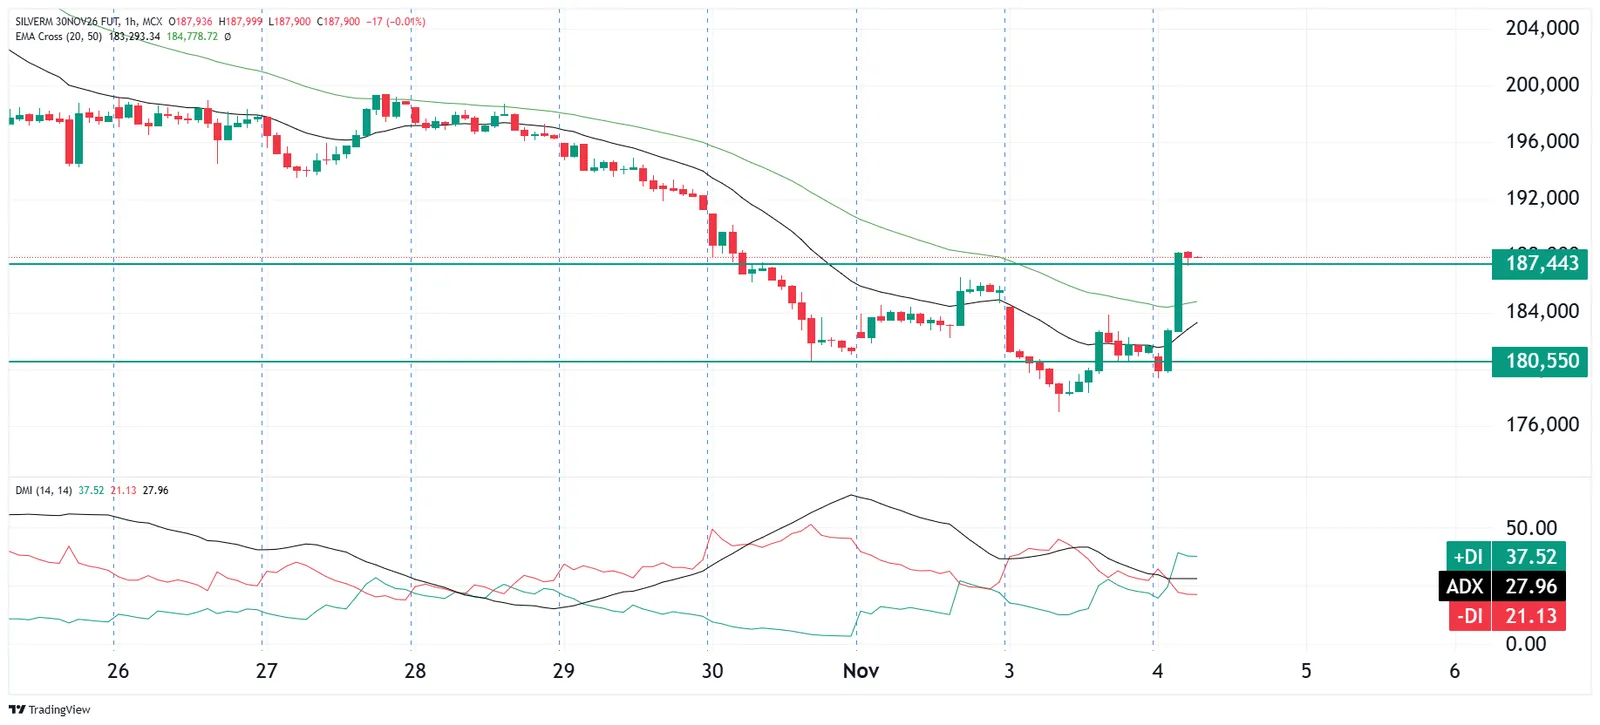
MCX Silver Mini 30 November futures are trading near ₹1,84,988. It is trading above the 20 hour EMA and just above the 50 hour EMA, so the structure is improving but price is only marginally clear of the broader average. Meanwhile, the ADX at 26.78 indicates a reasonably strong trend, although the narrow gap between the DI lines suggests the recovery still needs confirmation.

A sustained hourly close above ₹1,87,443 would open the way towards the next zone of ₹2,22,088, while an hourly close below ₹1,80,550 would undo the recovery and return the structure to negative.
SILVERM-30NOV26-FUT_2026-11-04_13-01-20.webp

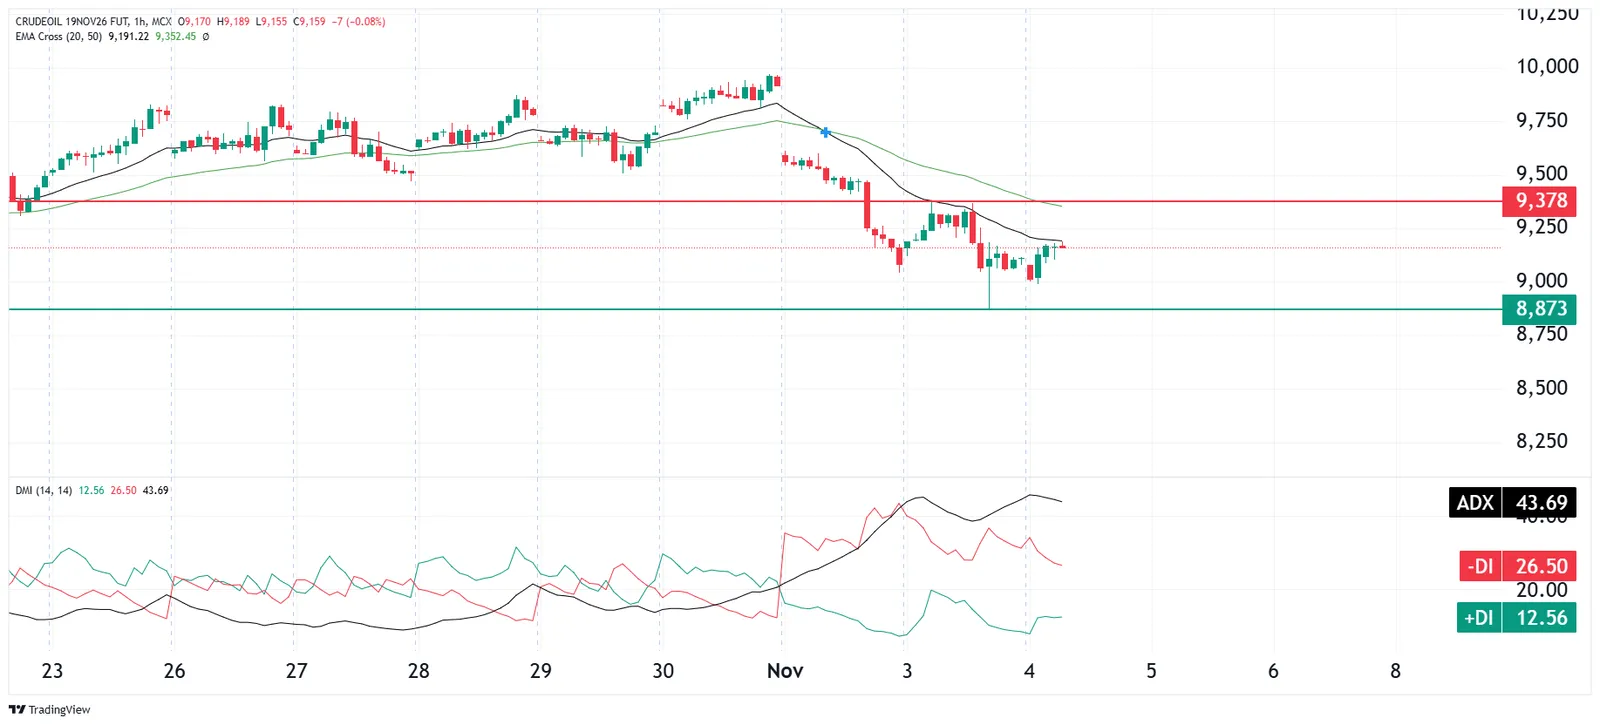
MCX Crude Oil 19 November futures are trading near ₹9,102, after a sharp fall from the ₹9,900 area in early November and a break below the rising trendline. Price is below the 20 hour EMA and the 50 hour EMA, with the 20 EMA below the 50 EMA, which keeps the hourly structure negative. Meanwhile,the ADX at 45.11 indicates a strong trend with sellers in control.

A sustained hourly close above ₹9,378 would ease the selling pressure and point to a possible recovery, while continued trade below the hourly EMAs keeps the downside pressure intact.
CRUDEOIL-19NOV26-FUT_2026-11-04_13-07-10.webp

Technical note: The 20-EMA reflects short-term price momentum, while the 50-EMA indicates the broader hourly trend. Price above both averages, particularly when the 20-EMA is above the 50-EMA, supports a positive structure; the reverse indicates a negative structure. In the DMI, +DI above -DI signals positive directional pressure, while -DI above +DI signals negative pressure. ADX measures trend strength rather than direction: readings below 20 generally indicate a weak or range-bound market, 20–25 suggest an emerging trend, and readings above 25 indicate a stronger trend. These indicators should be interpreted together with the stated support, resistance and confirmation levels.

Disclaimer: Derivatives trading must be done only by traders who fully understand the risks associated with them and strictly apply risk mechanisms like stop-losses. The information is only for the client's consumption, and such material should not be redistributed. We do not recommend any particular stock, securities, or strategies for trading. The securities quoted are exemplary and are not recommendatory. The stock names mentioned in this article are purely to show how to do analysis. Take your own decision before investing.

About The Author

Upstox logo
Kshitiz Bhutani is a derivatives trader and equity research analyst with over six years of experience in capital markets. His areas of expertise include derivatives strategies, technical analysis, pattern-based trading, equity research and market analysis.

Next Story

End of additional stories