Market News
Week ahead: FII sentiments, Maharashtra election, and global cues among key market triggers to watch
.png)
6 min read | Updated on November 18, 2024, 01:01 IST
SUMMARY
The broader trend for the NIFTY50 index is likely to remain sideways to bearish in the upcoming holiday-shortened week. The index may consolidate between 23,000 and 23,800 and a break of this range will provide further directional clues.

FII outflows, US dollar and Maharashtra polls among key triggers for the market this week
Markets extended the losses for the second week in a row and formed a bearish candle on the weekly chart. The NIFTY50 index closed below previous week’s low, ending the week at 23,532, a decline of 2.5% for the week. Sellers continued to dominate the Dalat Street, marking the seventh consecutive week of broad based selling. The downturn was led by relentless foreign investor outflows, strengthening U.S. dollar and rising concerns of retail inflation.
Except for IT (+0.8%), all the major sectoral indices ended the week deep in the red, with Metals (-5.1%) and PSU Banks (-5.1%) declining the most. The broader markets extended their losing streak and ended the week in the red. The NIFTY Midcap 100 index slipped 4.1%, while the Smallcap 100 index fell 4.5% for the week.
Index breadth- NIFTY50
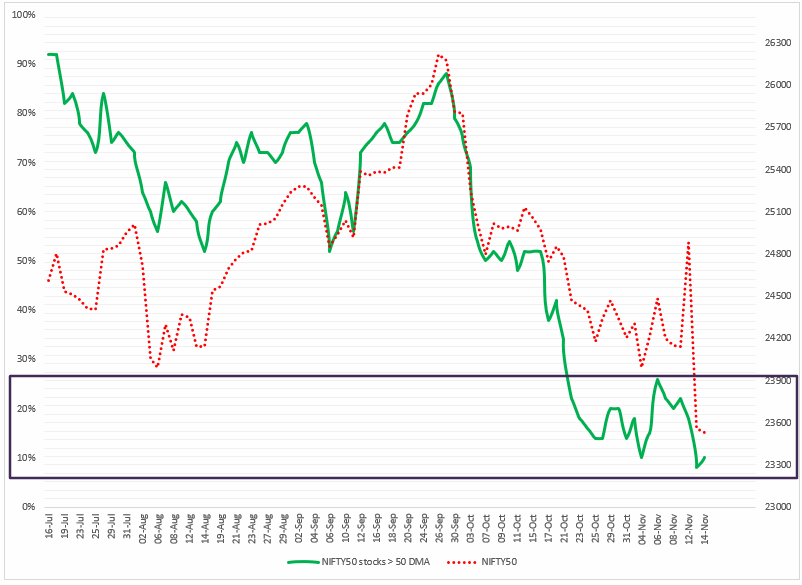
The NIFTY50 index showed no signs of improvement during the holiday-shortened week, with an average of 85% of its stocks trading below their respective 50-day moving averages (DMA). As of 15 November, only 10% of NIFTY50 stocks were trading above their 50 DMA, which is a clear indication of an oversold short-term structure. As shown in the chart below, the index breadth has consistently weakened, reaching single-digit levels.
FIIs positioning in the index
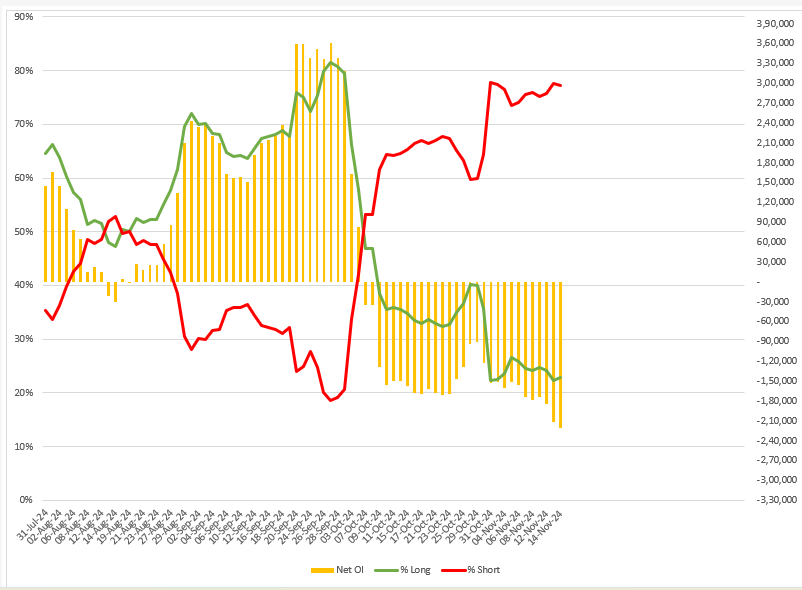
Foreign Institutional Investors (FIIs) maintained their bearish trend on the index futures throughout the week, with a long-to-short ratio of over 25:75. This clearly shows that the broader breadth of the index remains weak, with FIIs remaining net short on index futures.
As of 15 November, the long-to-short ratio of FIIs stood at 23:77 with the net open interest crossing the -2.21 lac contracts, highest in last one month. Against this backdrop, traders should remain cautious and monitor change in long-to-short ratio closely. Additionally, initiating fresh short positions at this stage appears unfavorable from a risk-reward perspective, given the heavy skew in favor of short contracts. Traders should focus on price action around key support zones and devise strategies accordingly to navigate the market volatility effectively.
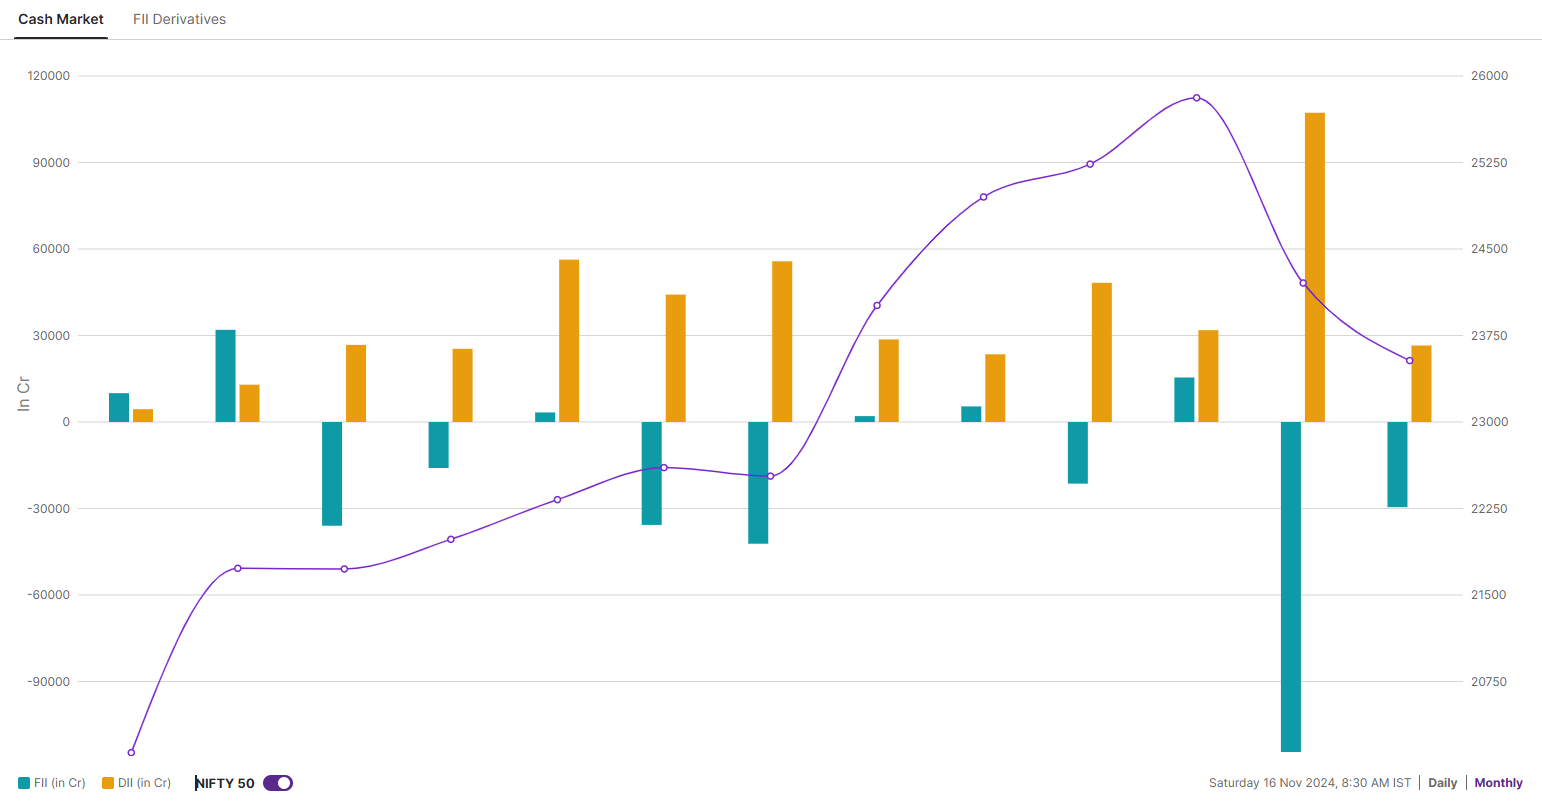
In the cash market, Foreign Institutional Investors (FIIs) continued their selling spree, offloading shares worth ₹29,533 crore as of 15 November, following offloading of shares worth ₹1.14 lakh crore in October. However, Domestic Institutional Investors (DIIs) provided crucial support, purchasing shares worth ₹26,522 crore in November, helping to stabilize the markets amidst persistent foreign outflows.
NIFTY50 outlook
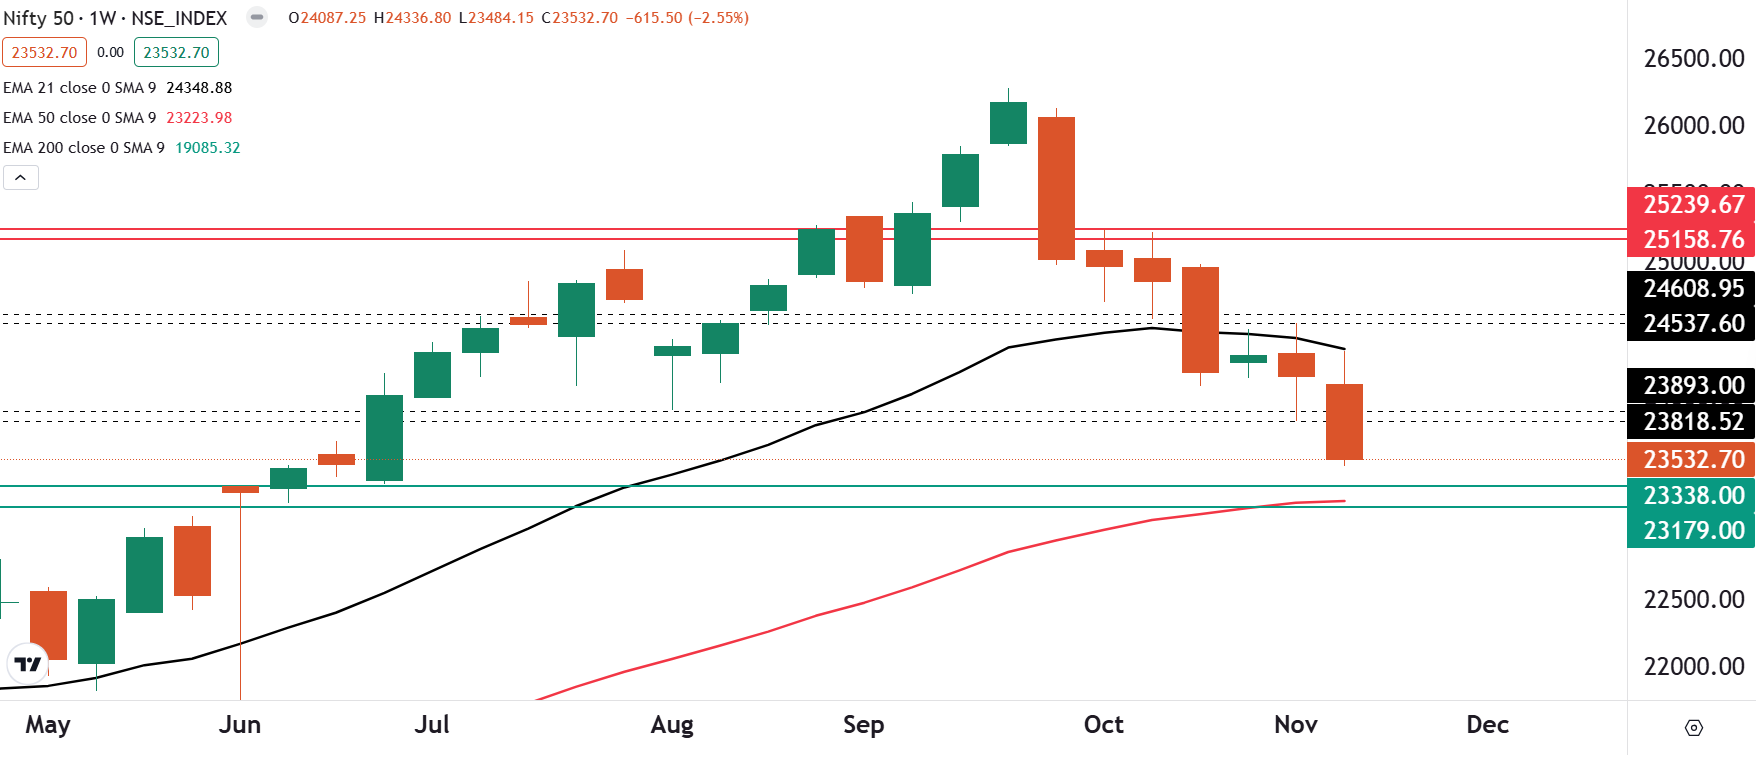
The technical structure of the NIFTY50 index remains weak, as reflected by the formation of a bearish marubozu candle on the weekly chart, signaling strong bearish sentiment. Additionally, the index is trading below its 21-week exponential moving average (WEMA), reaffirming the bearish trend in the broader market. Immediate support is seen at the 50-week EMA (23,200), and the index may extend its weakness toward this crucial support zone. In the coming sessions, consolidation around these levels is expected as the market attempts to stabilize.
SENSEX outlook
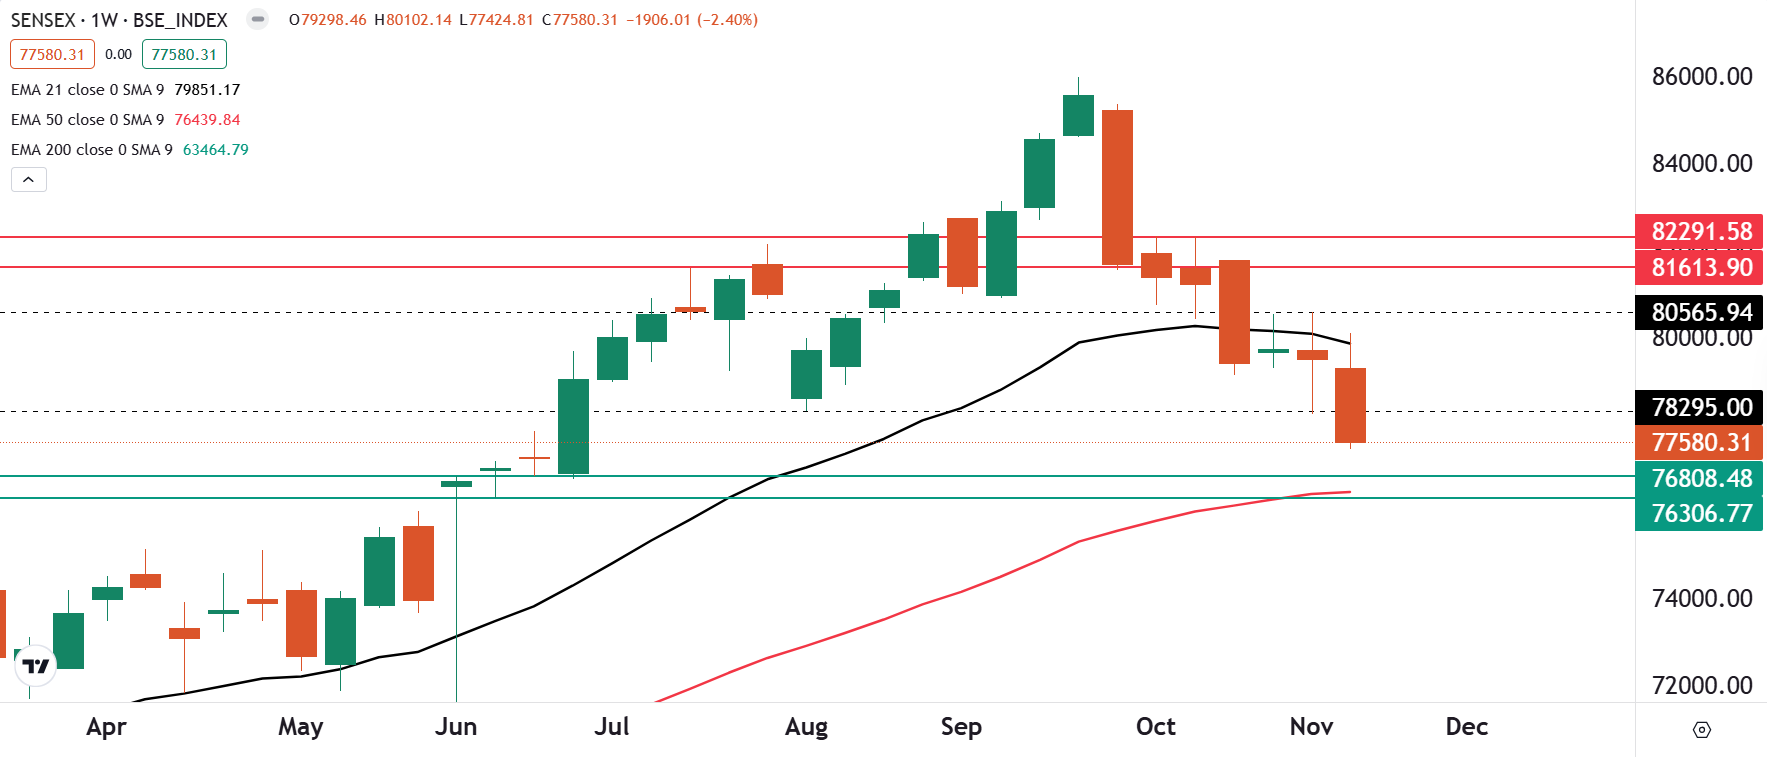
The weekly chart of the SENSEX also reflects the trend of the index remains bearish as it closed below previous week’s doji candle. The index also formed a bearish marubozu candle on the weekly chart and is currently trading below the 20 weekly exponential moving average (WEMA). As shown in the chart below, the next support zone of the index is around 76,300 and 76,800 zone, which also coincides with its 50 WEMA.
For the upcoming sessions, the NIFTY50 index has the crucial support zone between 23,100 and 23,300 as it coincides with its weekly 50 exponential moving average and the high of the June General elections. The broader trend of the index remains weak but traders should monitor the price action of the index around this crucial support zone. If the index breaks this range on closing basis on daily chart, it may extend the weakness upto 23,000 zone. Meanwhile, the immediate resistance for the index stands around 23,800 zone.
To stay updated on any changes in these levels and all intraday developments, be sure to check out our daily morning trade setup blog, available before the market opens at 8 am.
About The Author
Next Story

